
Executive summary
Odora is the customer-facing web portal of the MUI Platform. It gives plant operations, EHS, and sustainability teams a single browser-based workspace to see every station their organization owns, watch live odor and air-quality readings stream in, investigate smell events as they happen, generate PDF reports for regulators or management, and manage who in their team has access — all without involving the customer's IT department. Each customer organization sees only its own stations and data; isolation is enforced at the data layer, at the API layer, and inside every page of the application.
What customers see
The portal exposes ten primary views, each scoped to the customer's own organization. Each view is described below alongside a representative screenshot — all captures use a light theme; sample data shown.
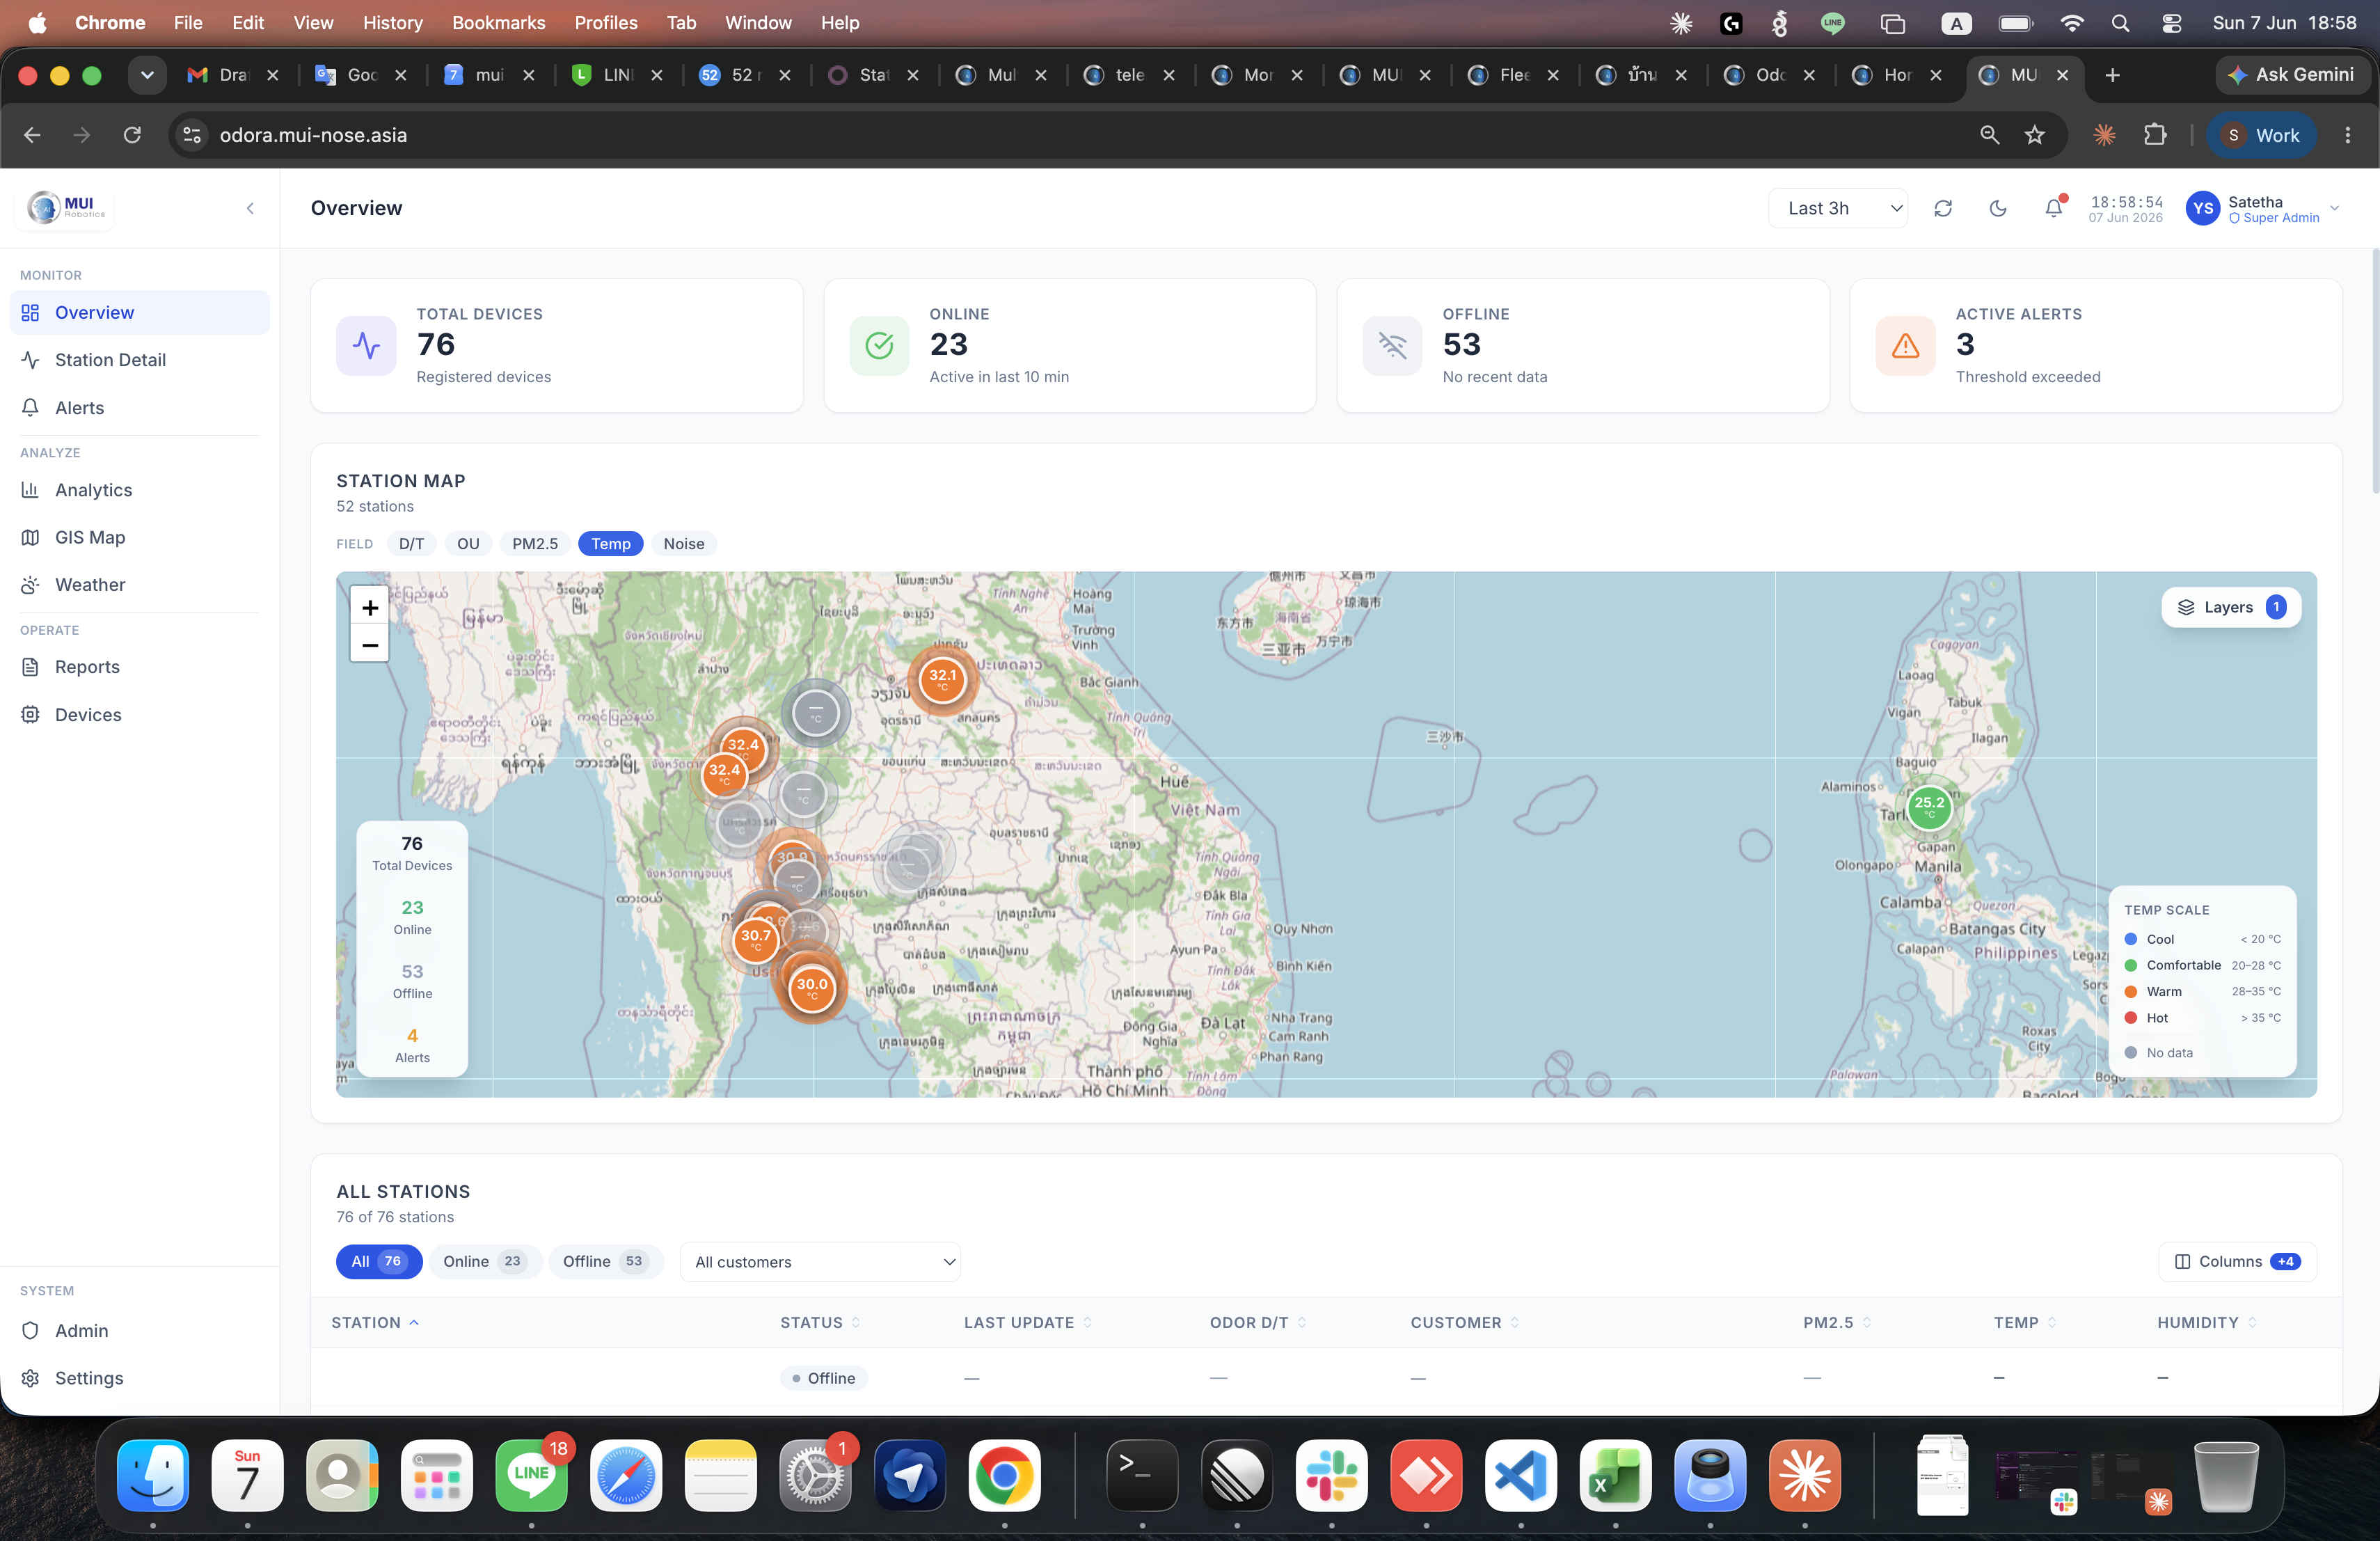
Overview (fleet view)
Sortable table of every station the customer owns — status, last update, odor (D/T), and up to six optional metrics (PM2.5, temperature, humidity, wind, pressure, PM10, noise). Column layout is saved per admin.
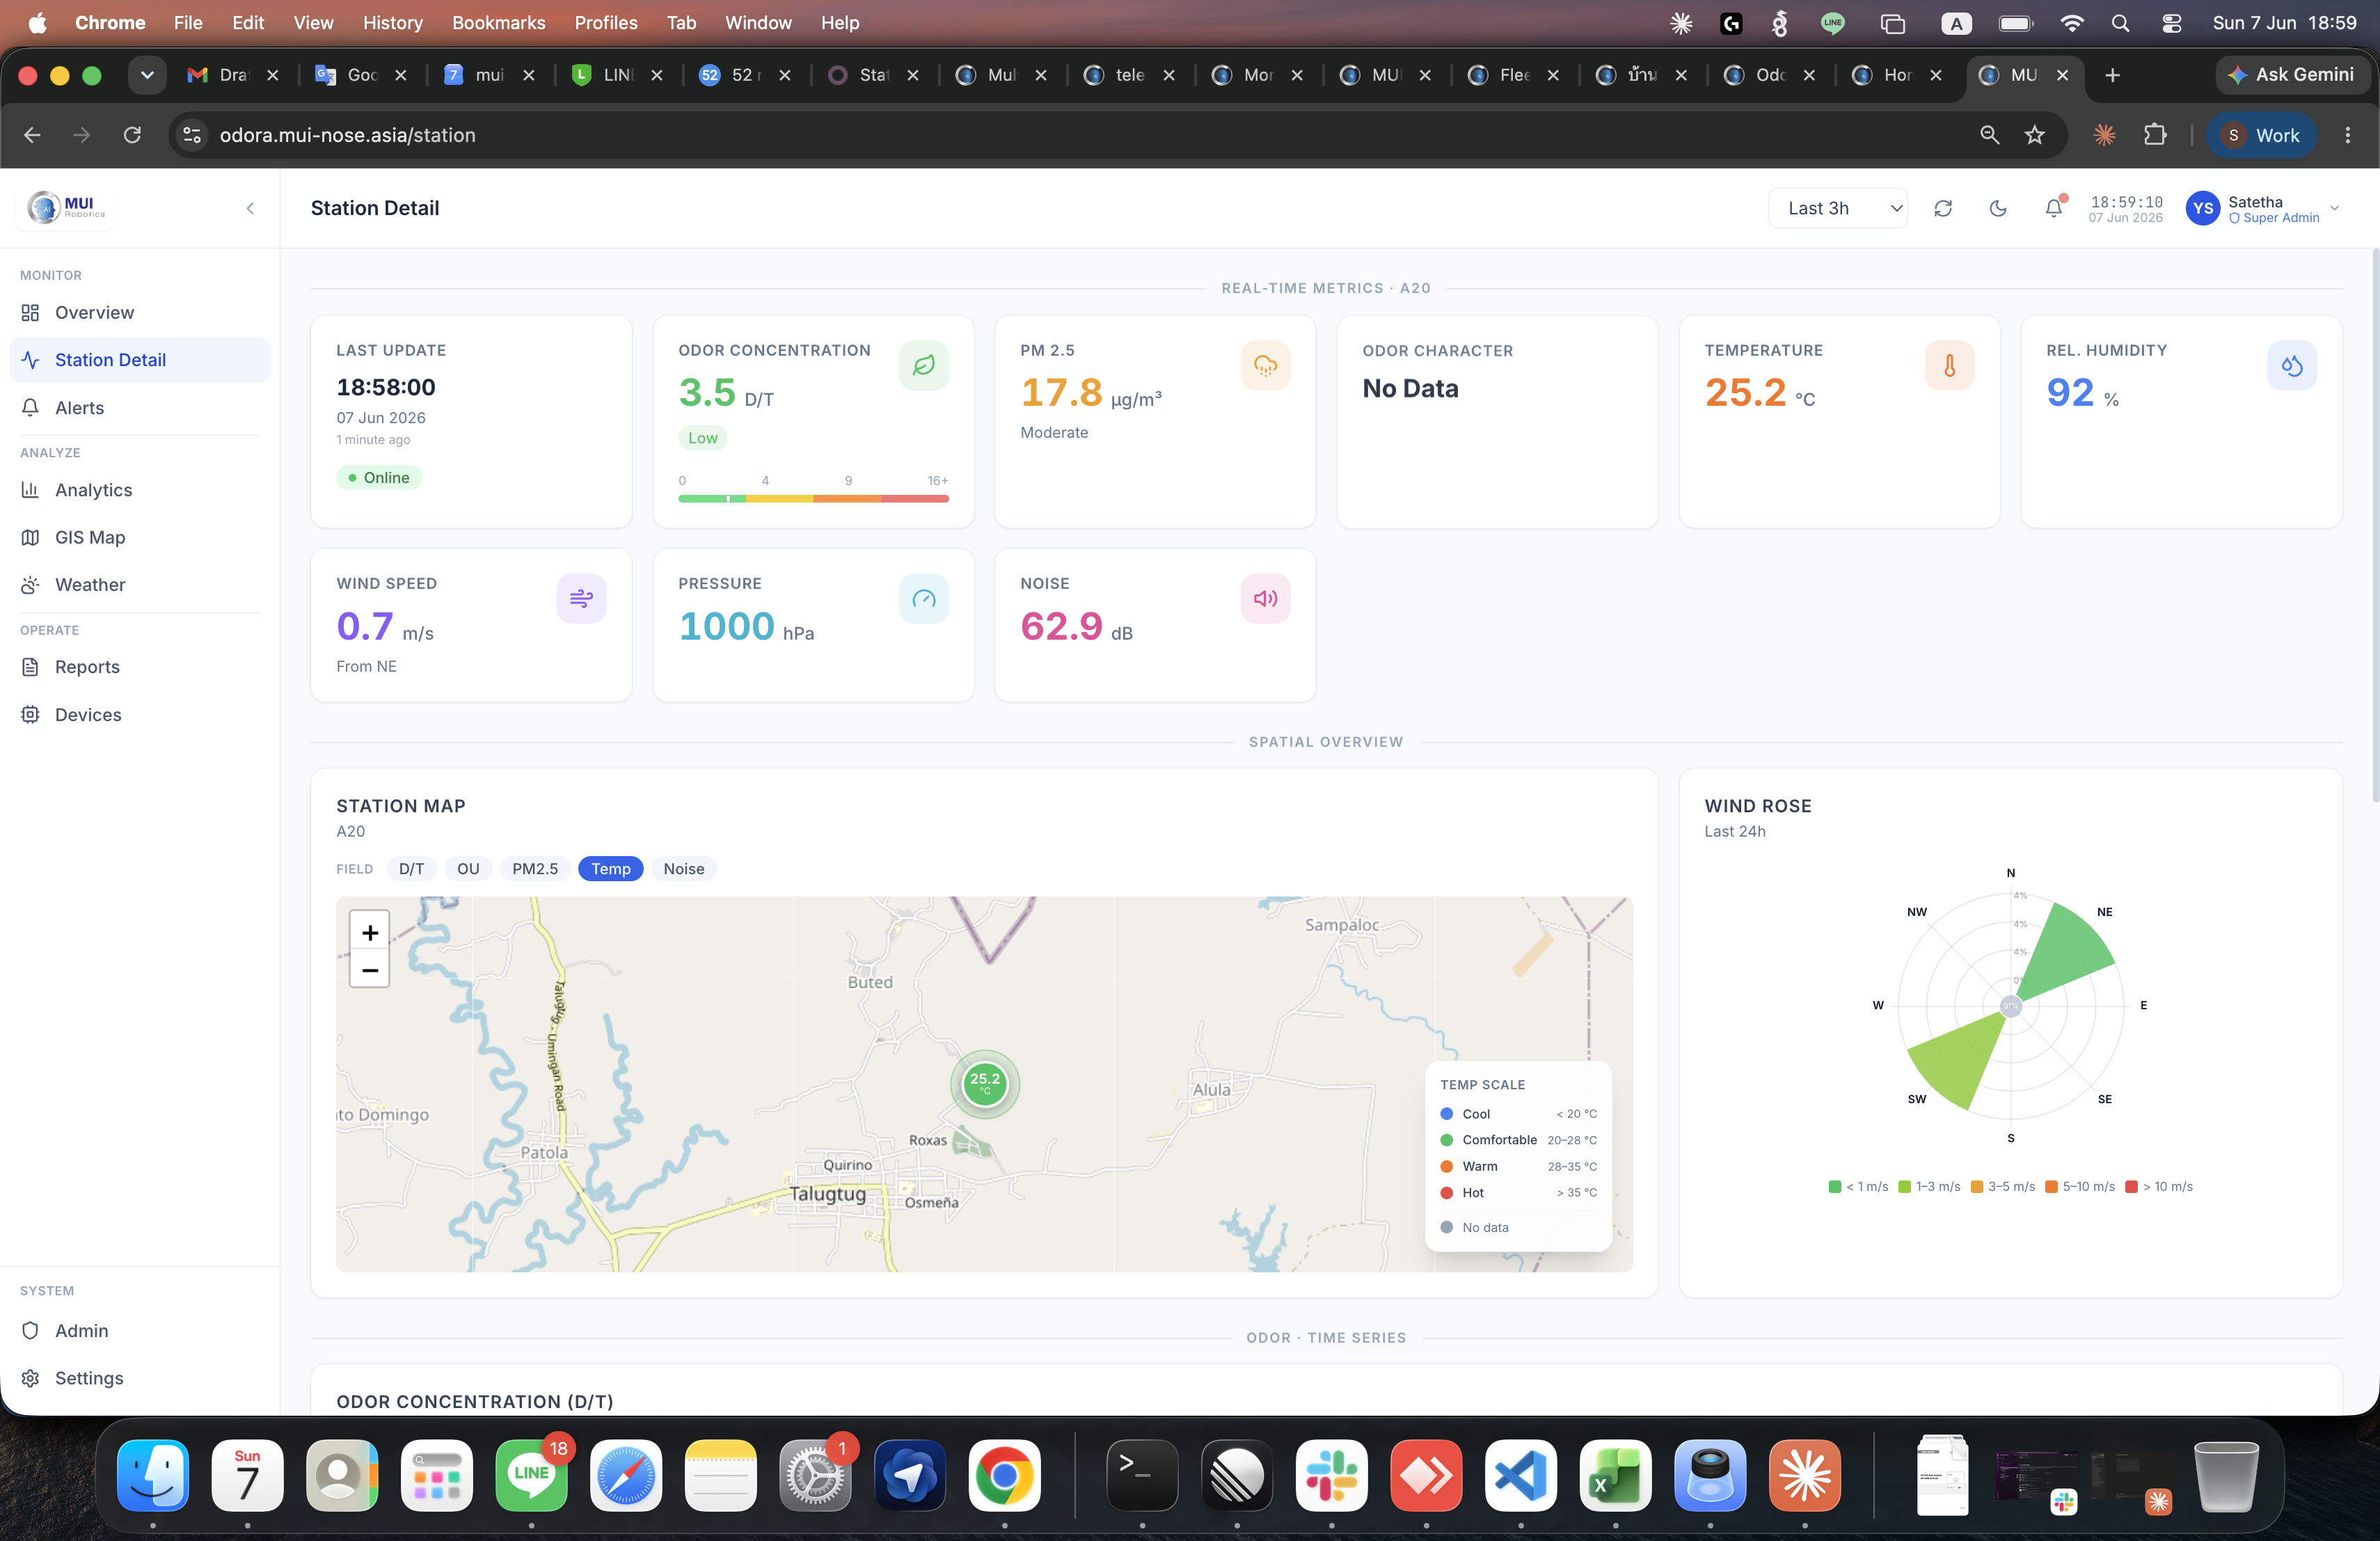
Station detail
Full single-station workspace: KPI cards, station map, wind rose, odor time-series, hourly trend charts, and data export panel.
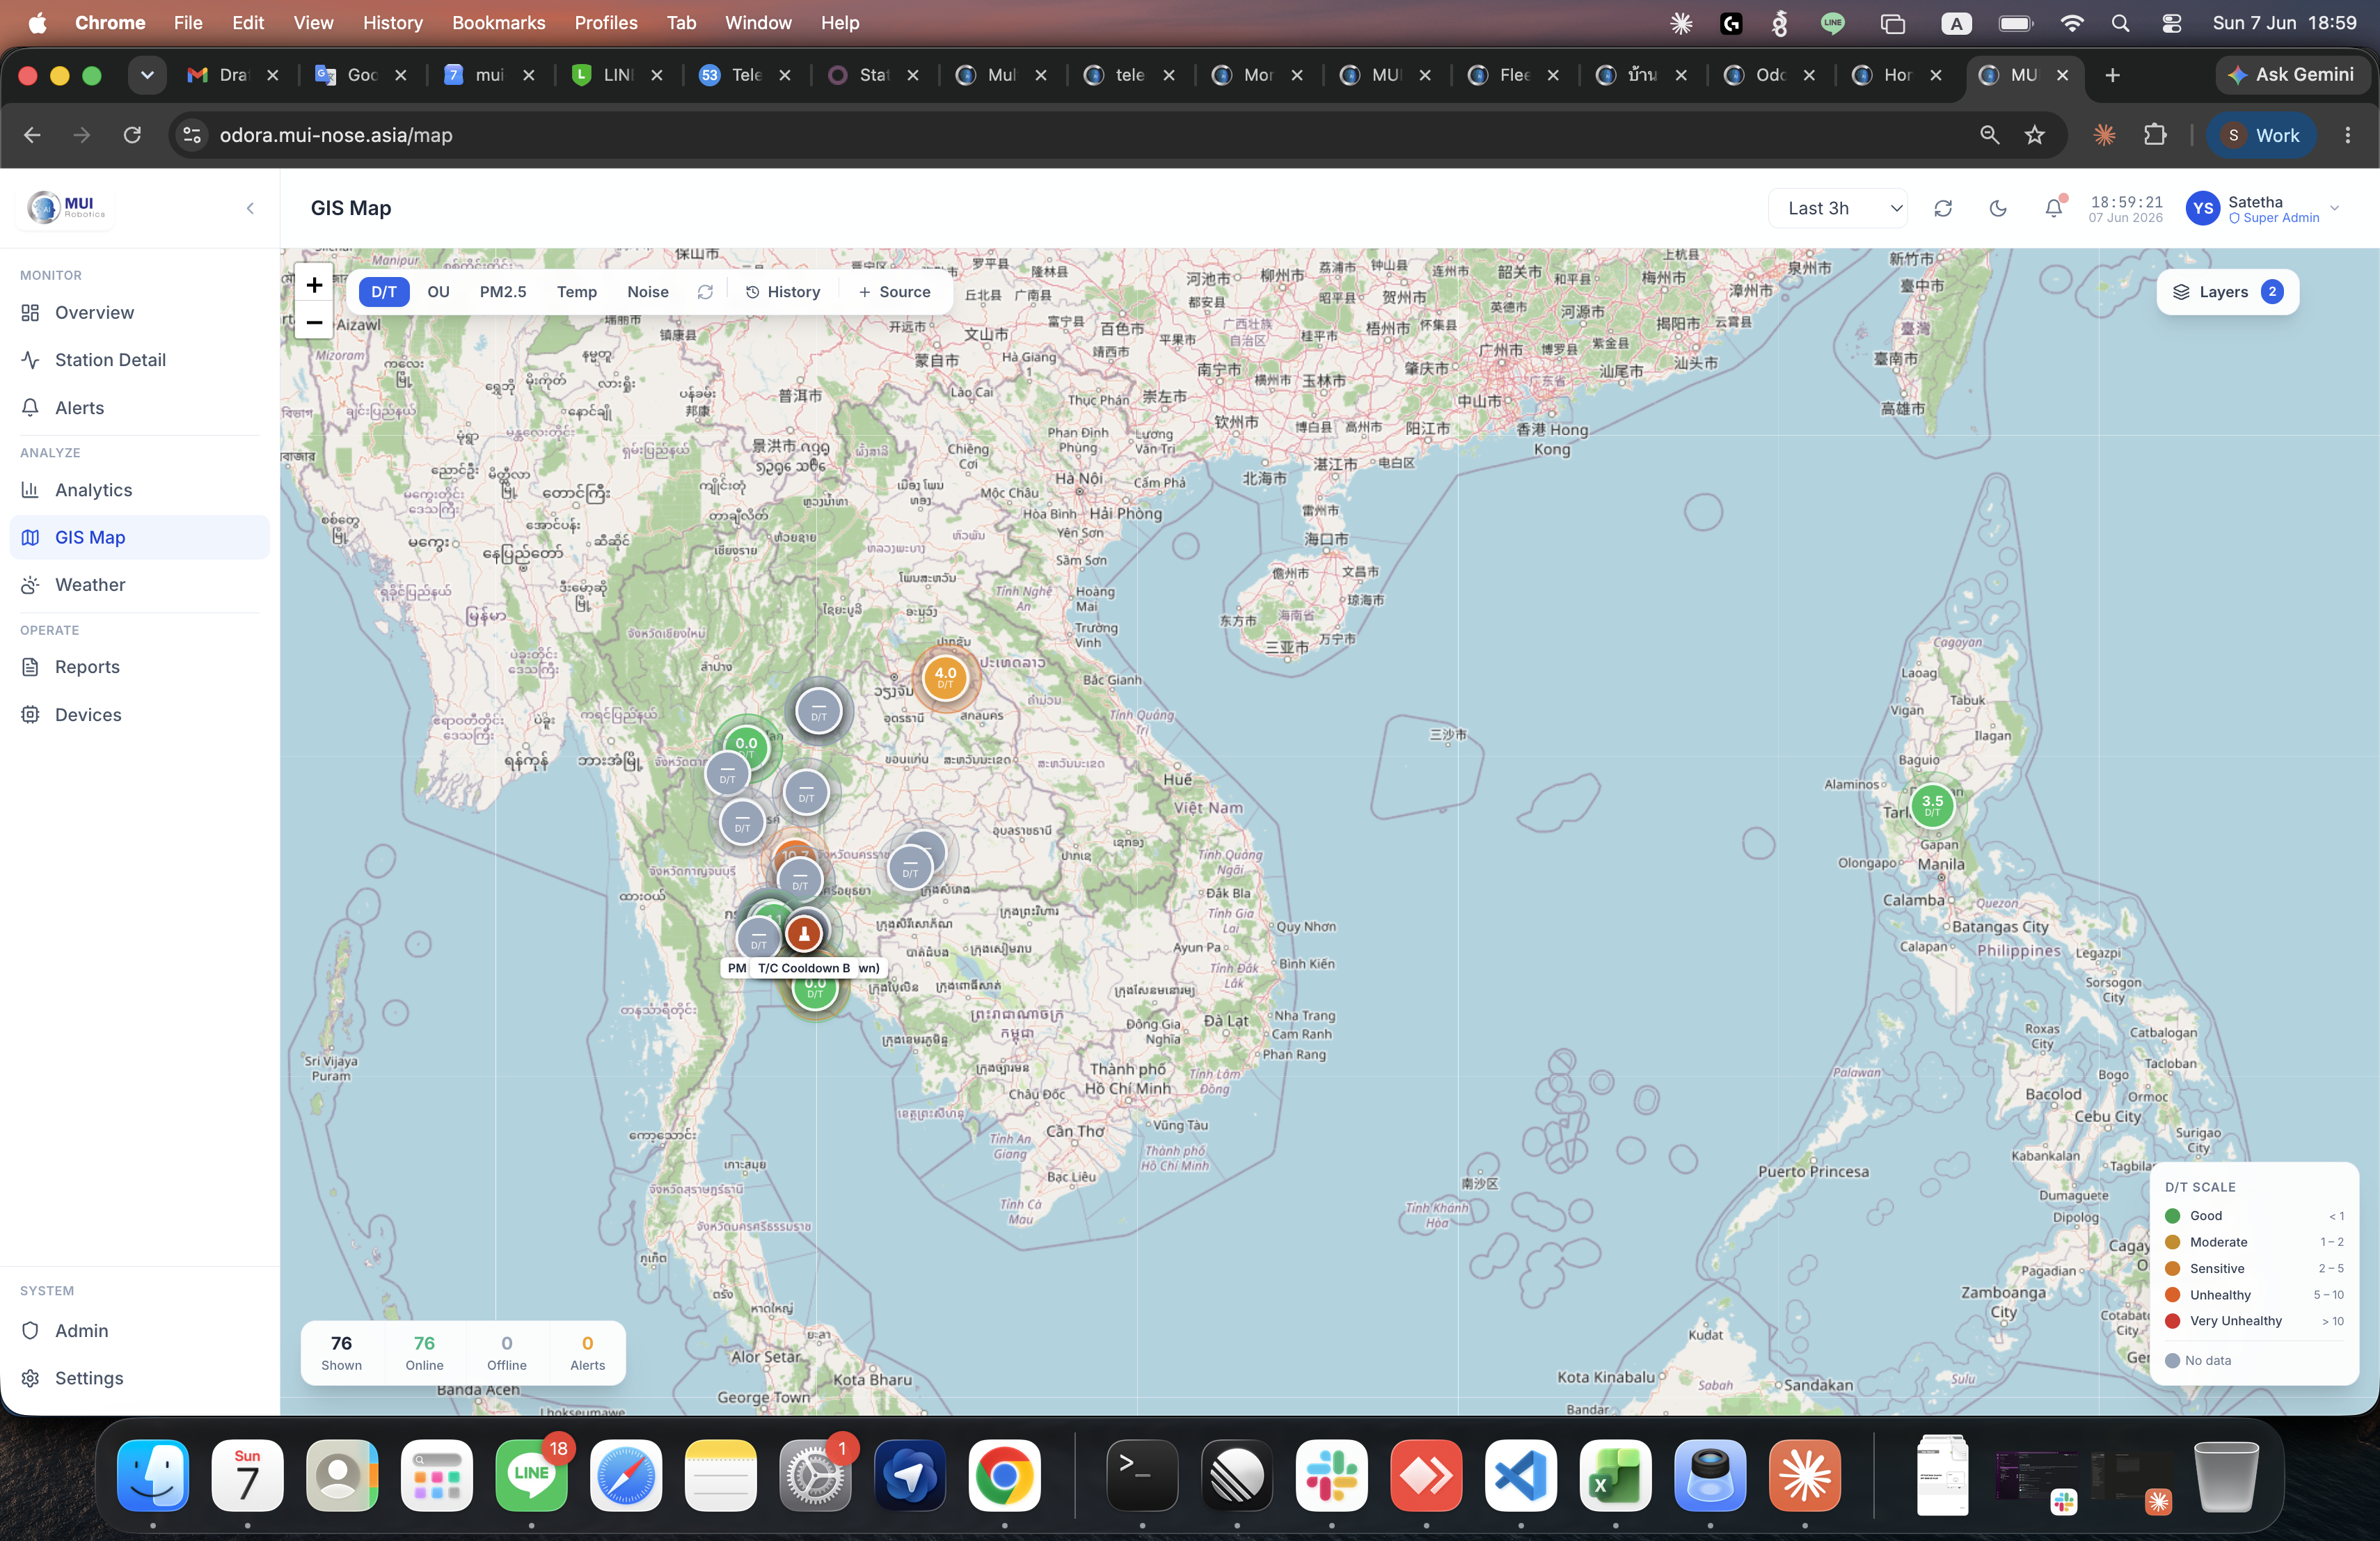
GIS Map
Full-screen interactive Leaflet map. Stations are colour-coded against an AQI scale; the operator can switch the colour field (D/T, OU, PM2.5, temperature, noise), toggle online-only or alert-only layers, and click any marker for a slide-in detail panel.
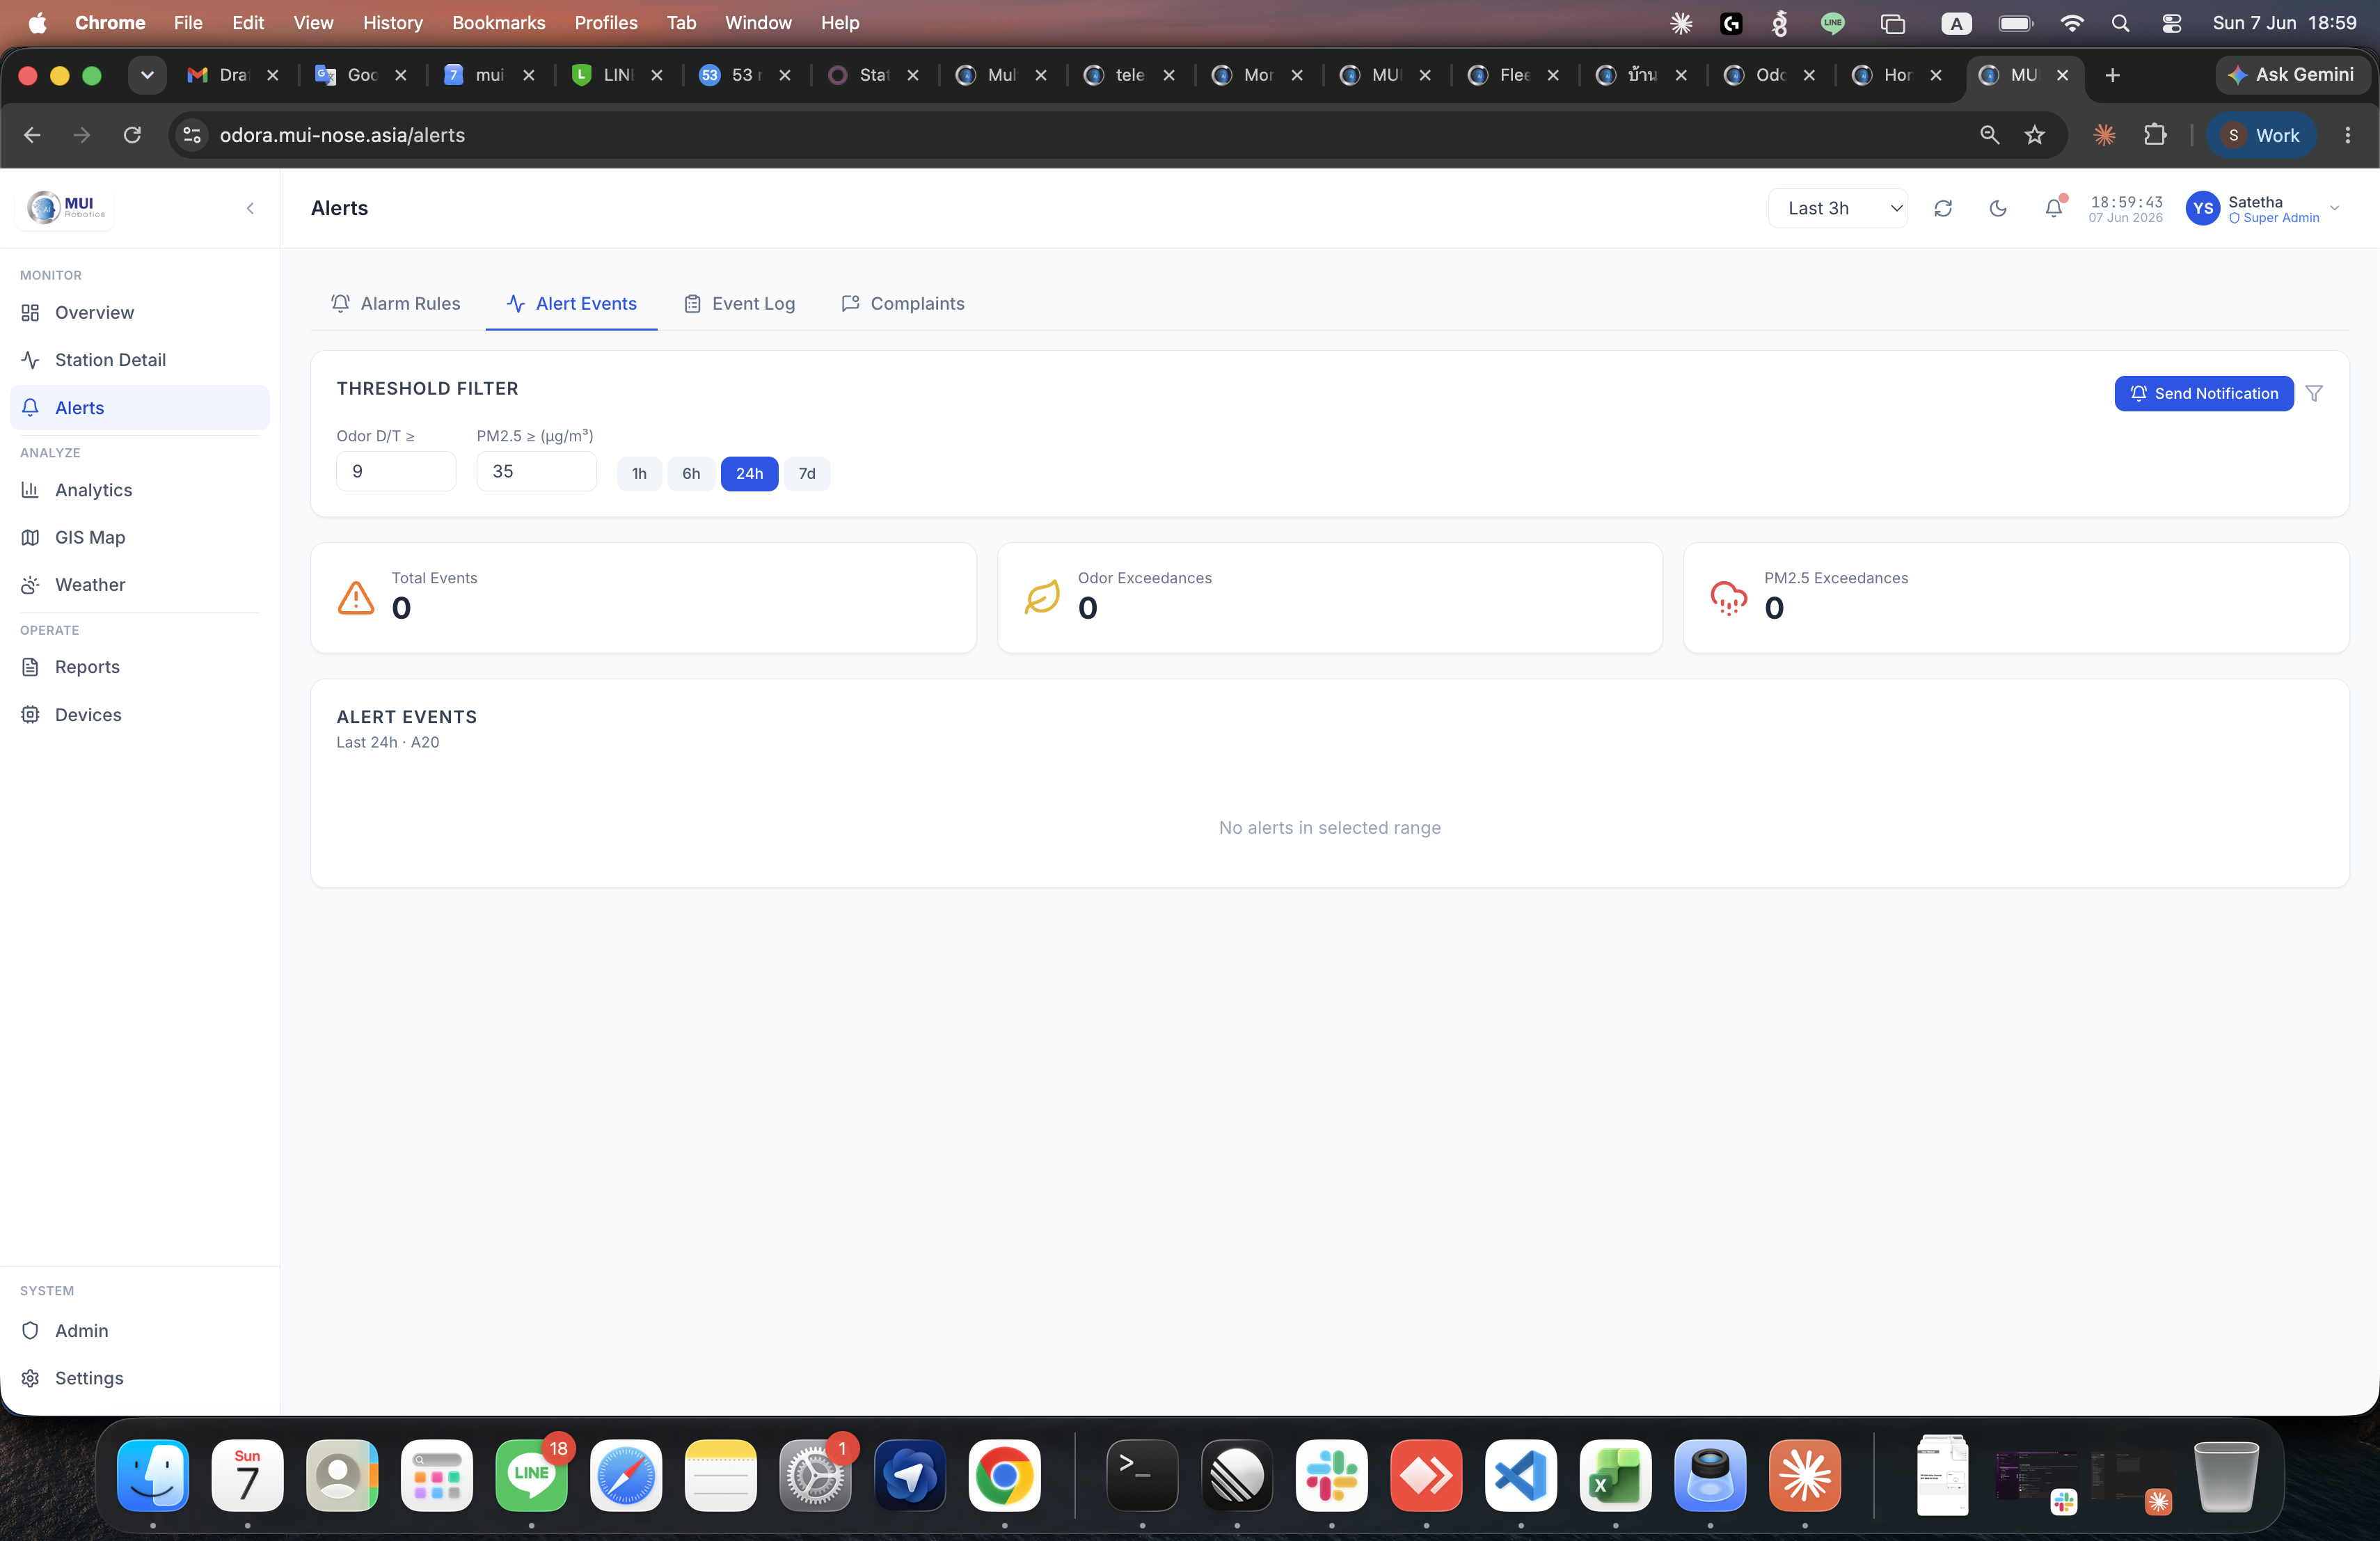
Alerts
Three tabs — Alarm Rules (CRUD builder for threshold rules), Alert Events (live exceedance log driven by the time-series database), and Event Log (justify, filter, archive).
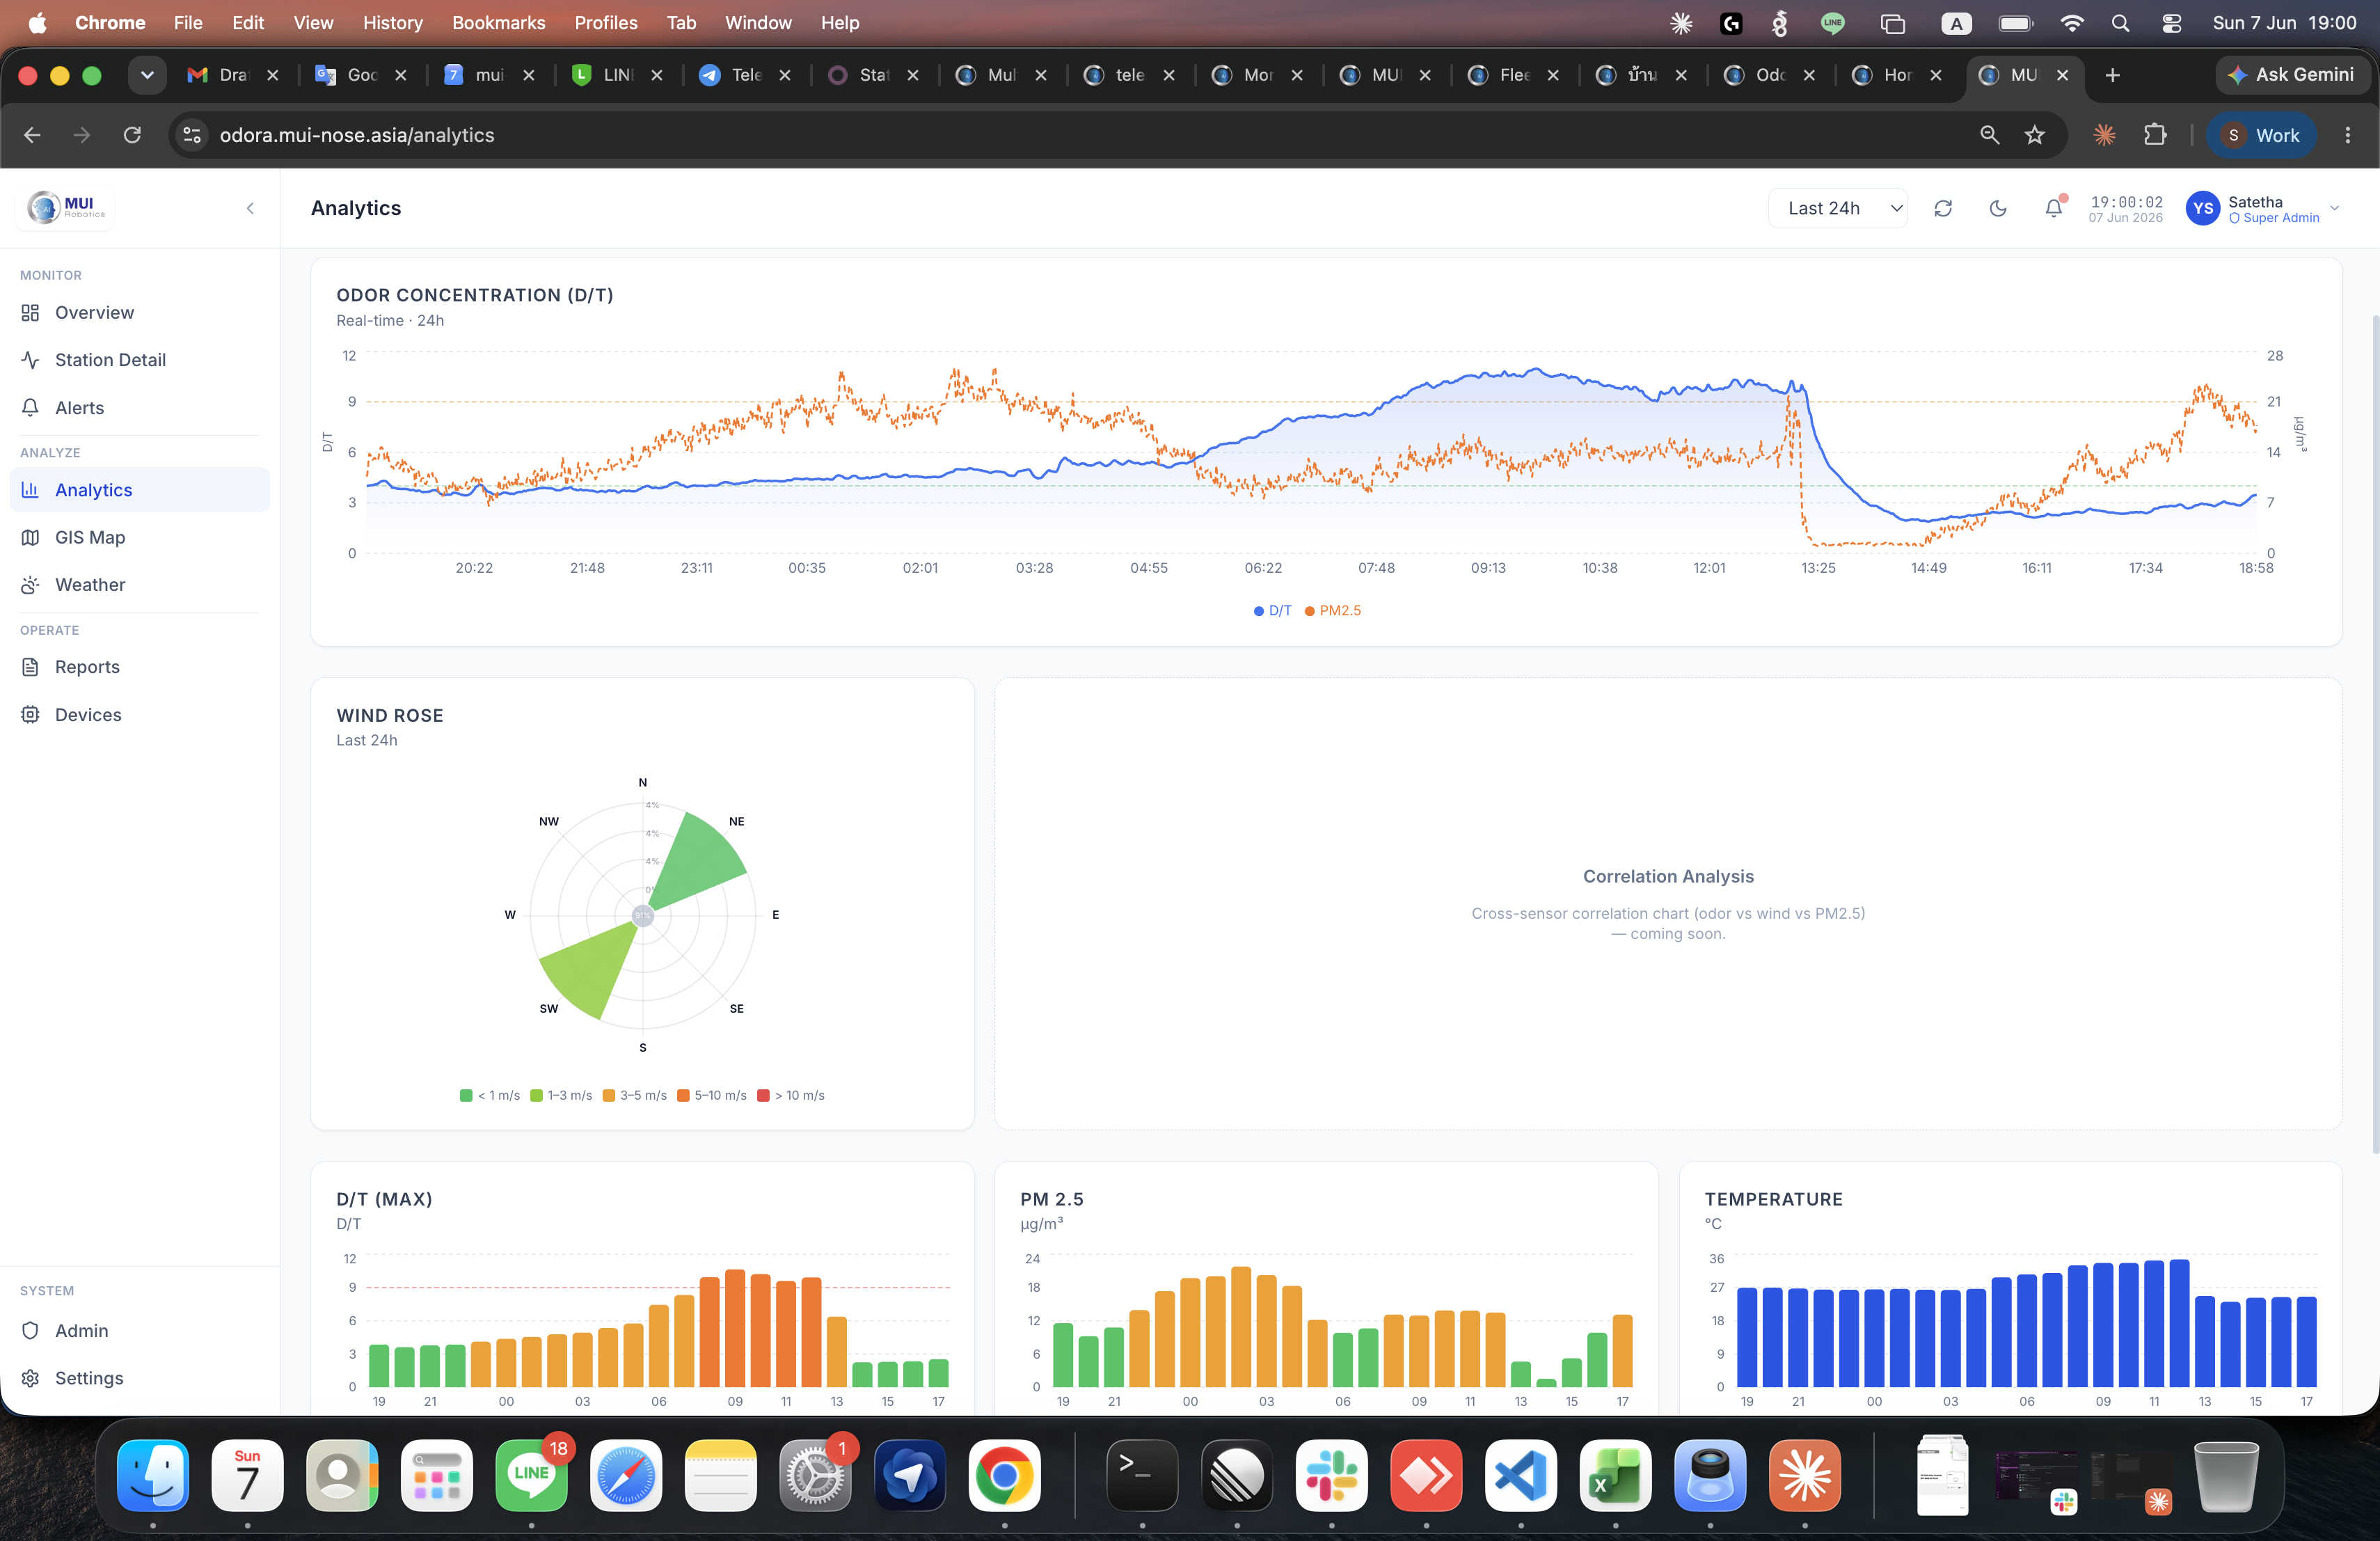
Analytics
Six analysis tabs — Temporal (time series + wind rose), Statistical (concentration histograms, trend indicator), AQI Analysis (daily MIN/MAX/AVG bars + AQI breakdown), Heat Map (date × hour grid), Event Frequency, and Justification breakdown.
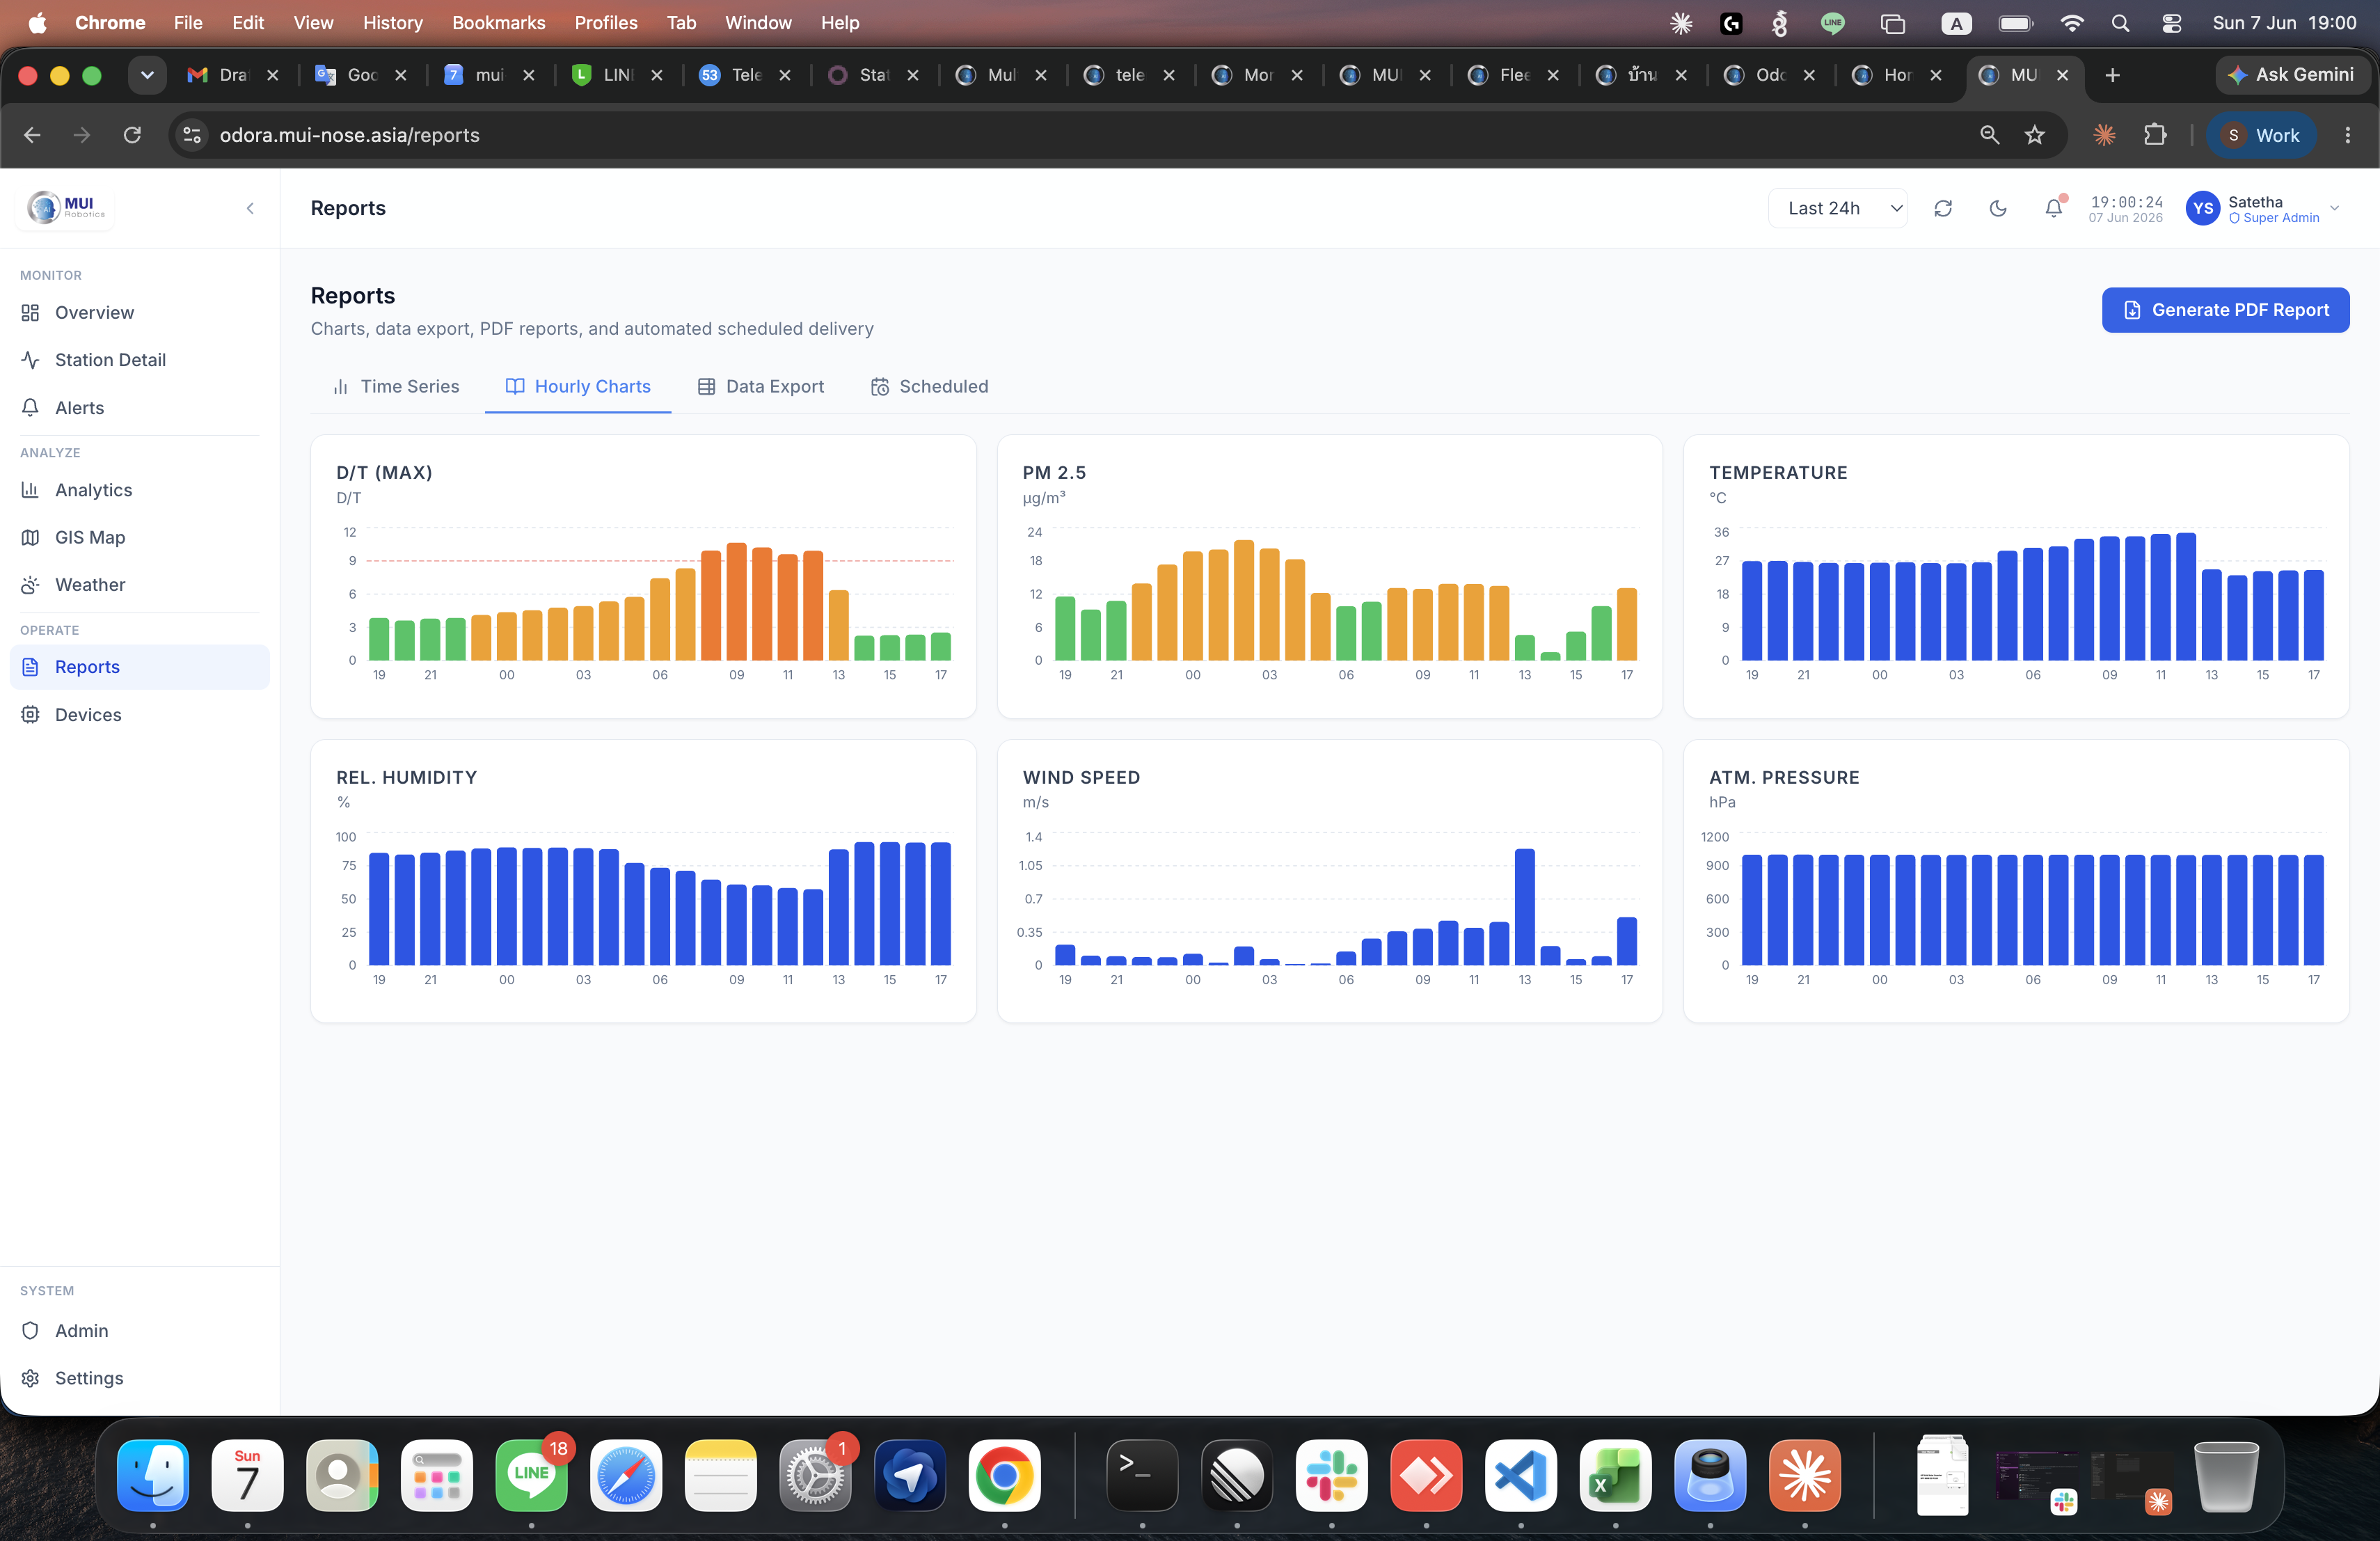
Reports
Tab-based report workspace — Time Series, Hourly Charts, Data Export (CSV / Excel from the export table), and Scheduled Reports.
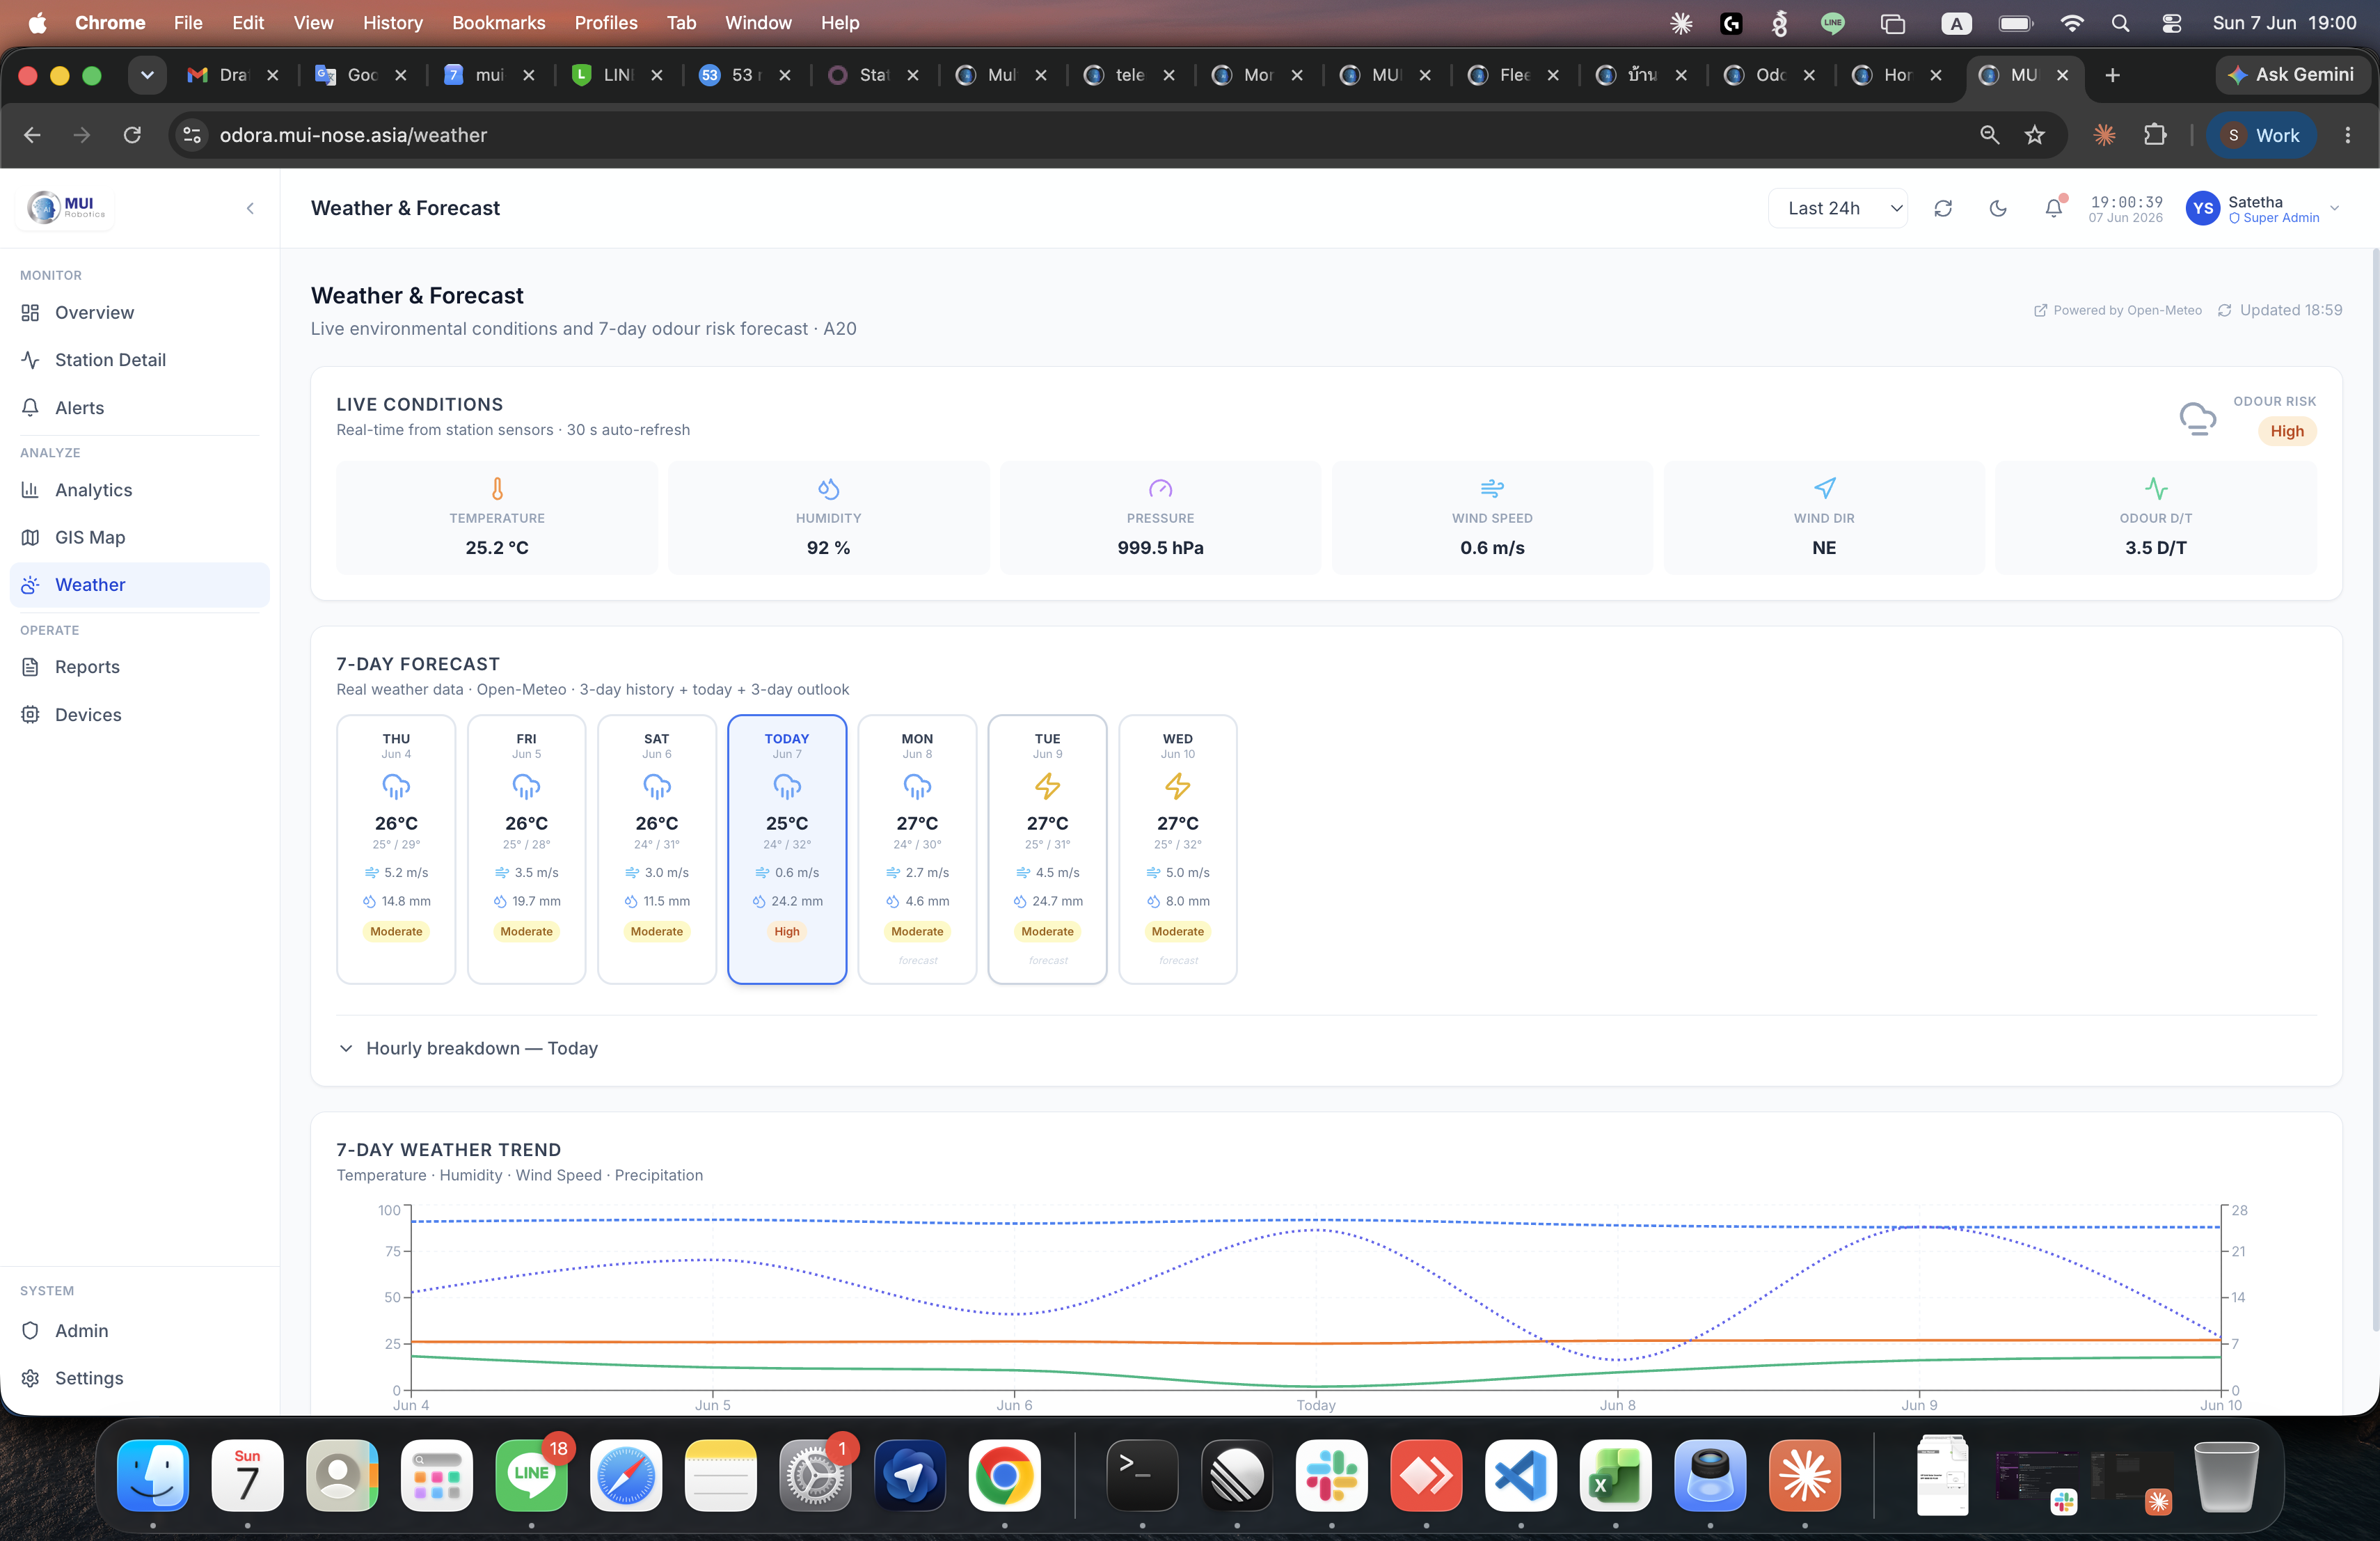
Weather
Live conditions panel plus a 7-day forecast strip and hourly breakdown, sourced from Open-Meteo where the station has GPS coordinates, with sensor-driven current readings.
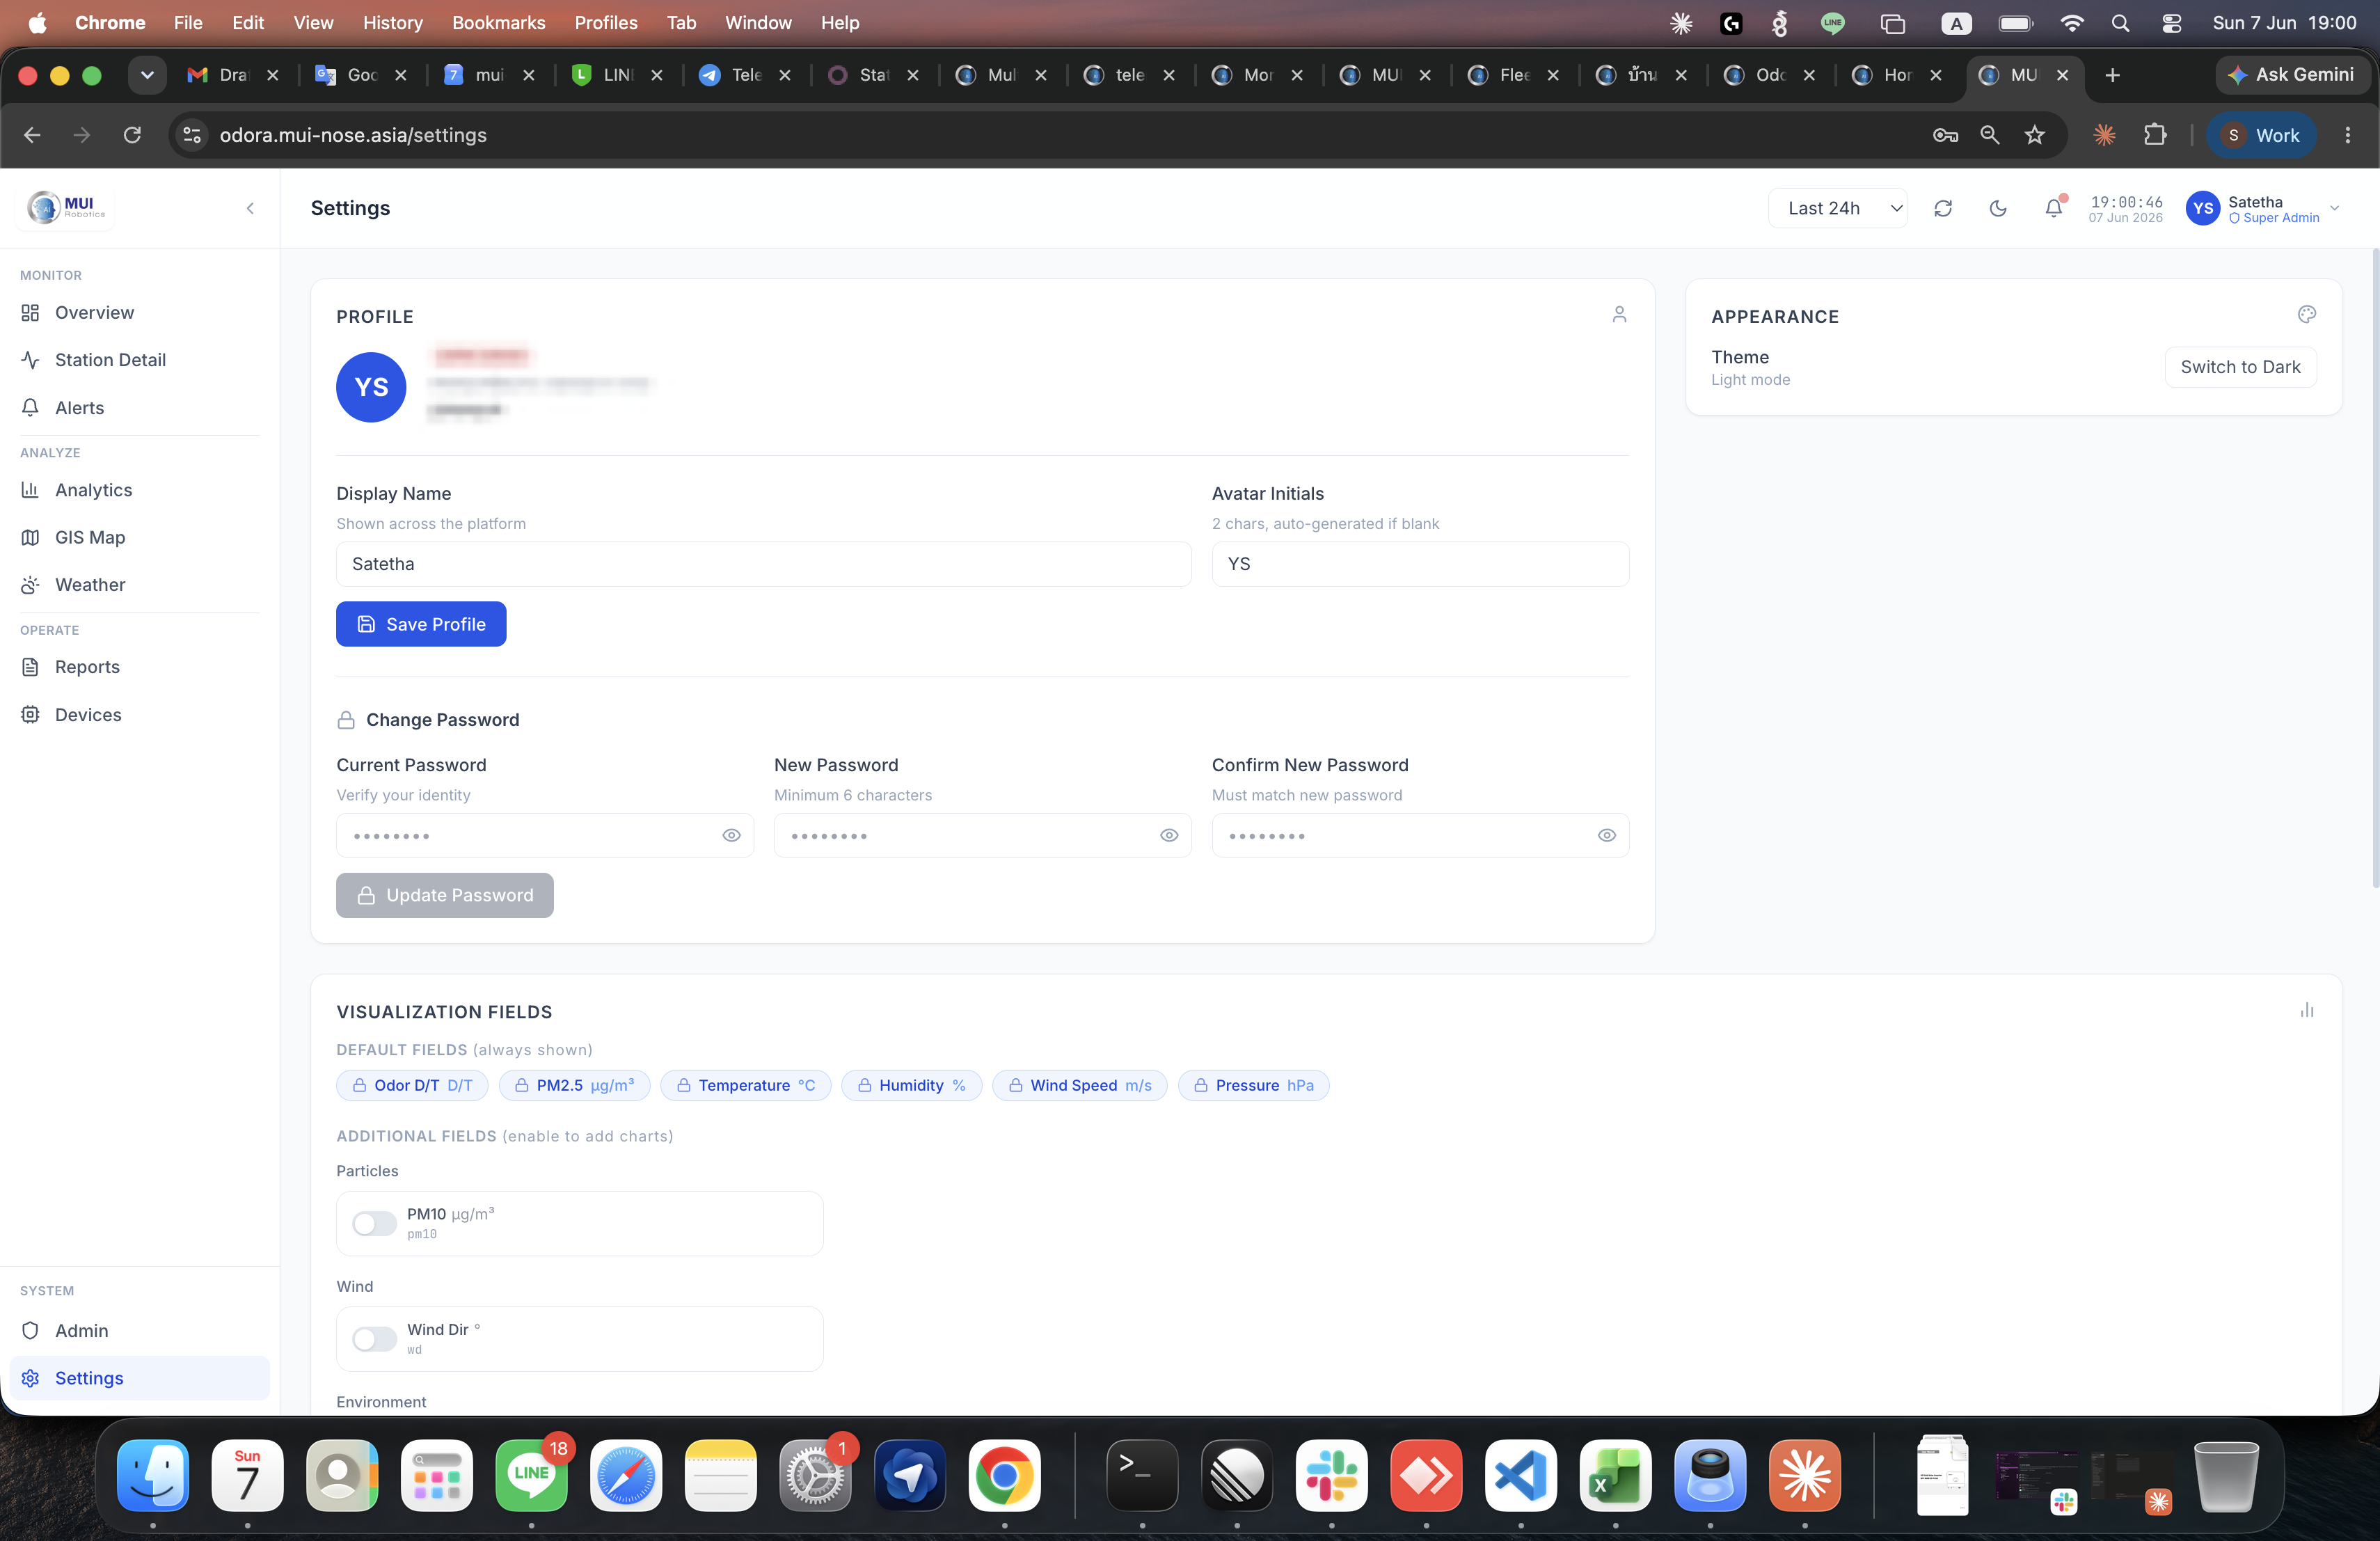
Settings
Per-user profile, theme, password change, per-field AQI thresholds and averaging period, and notification recipients.
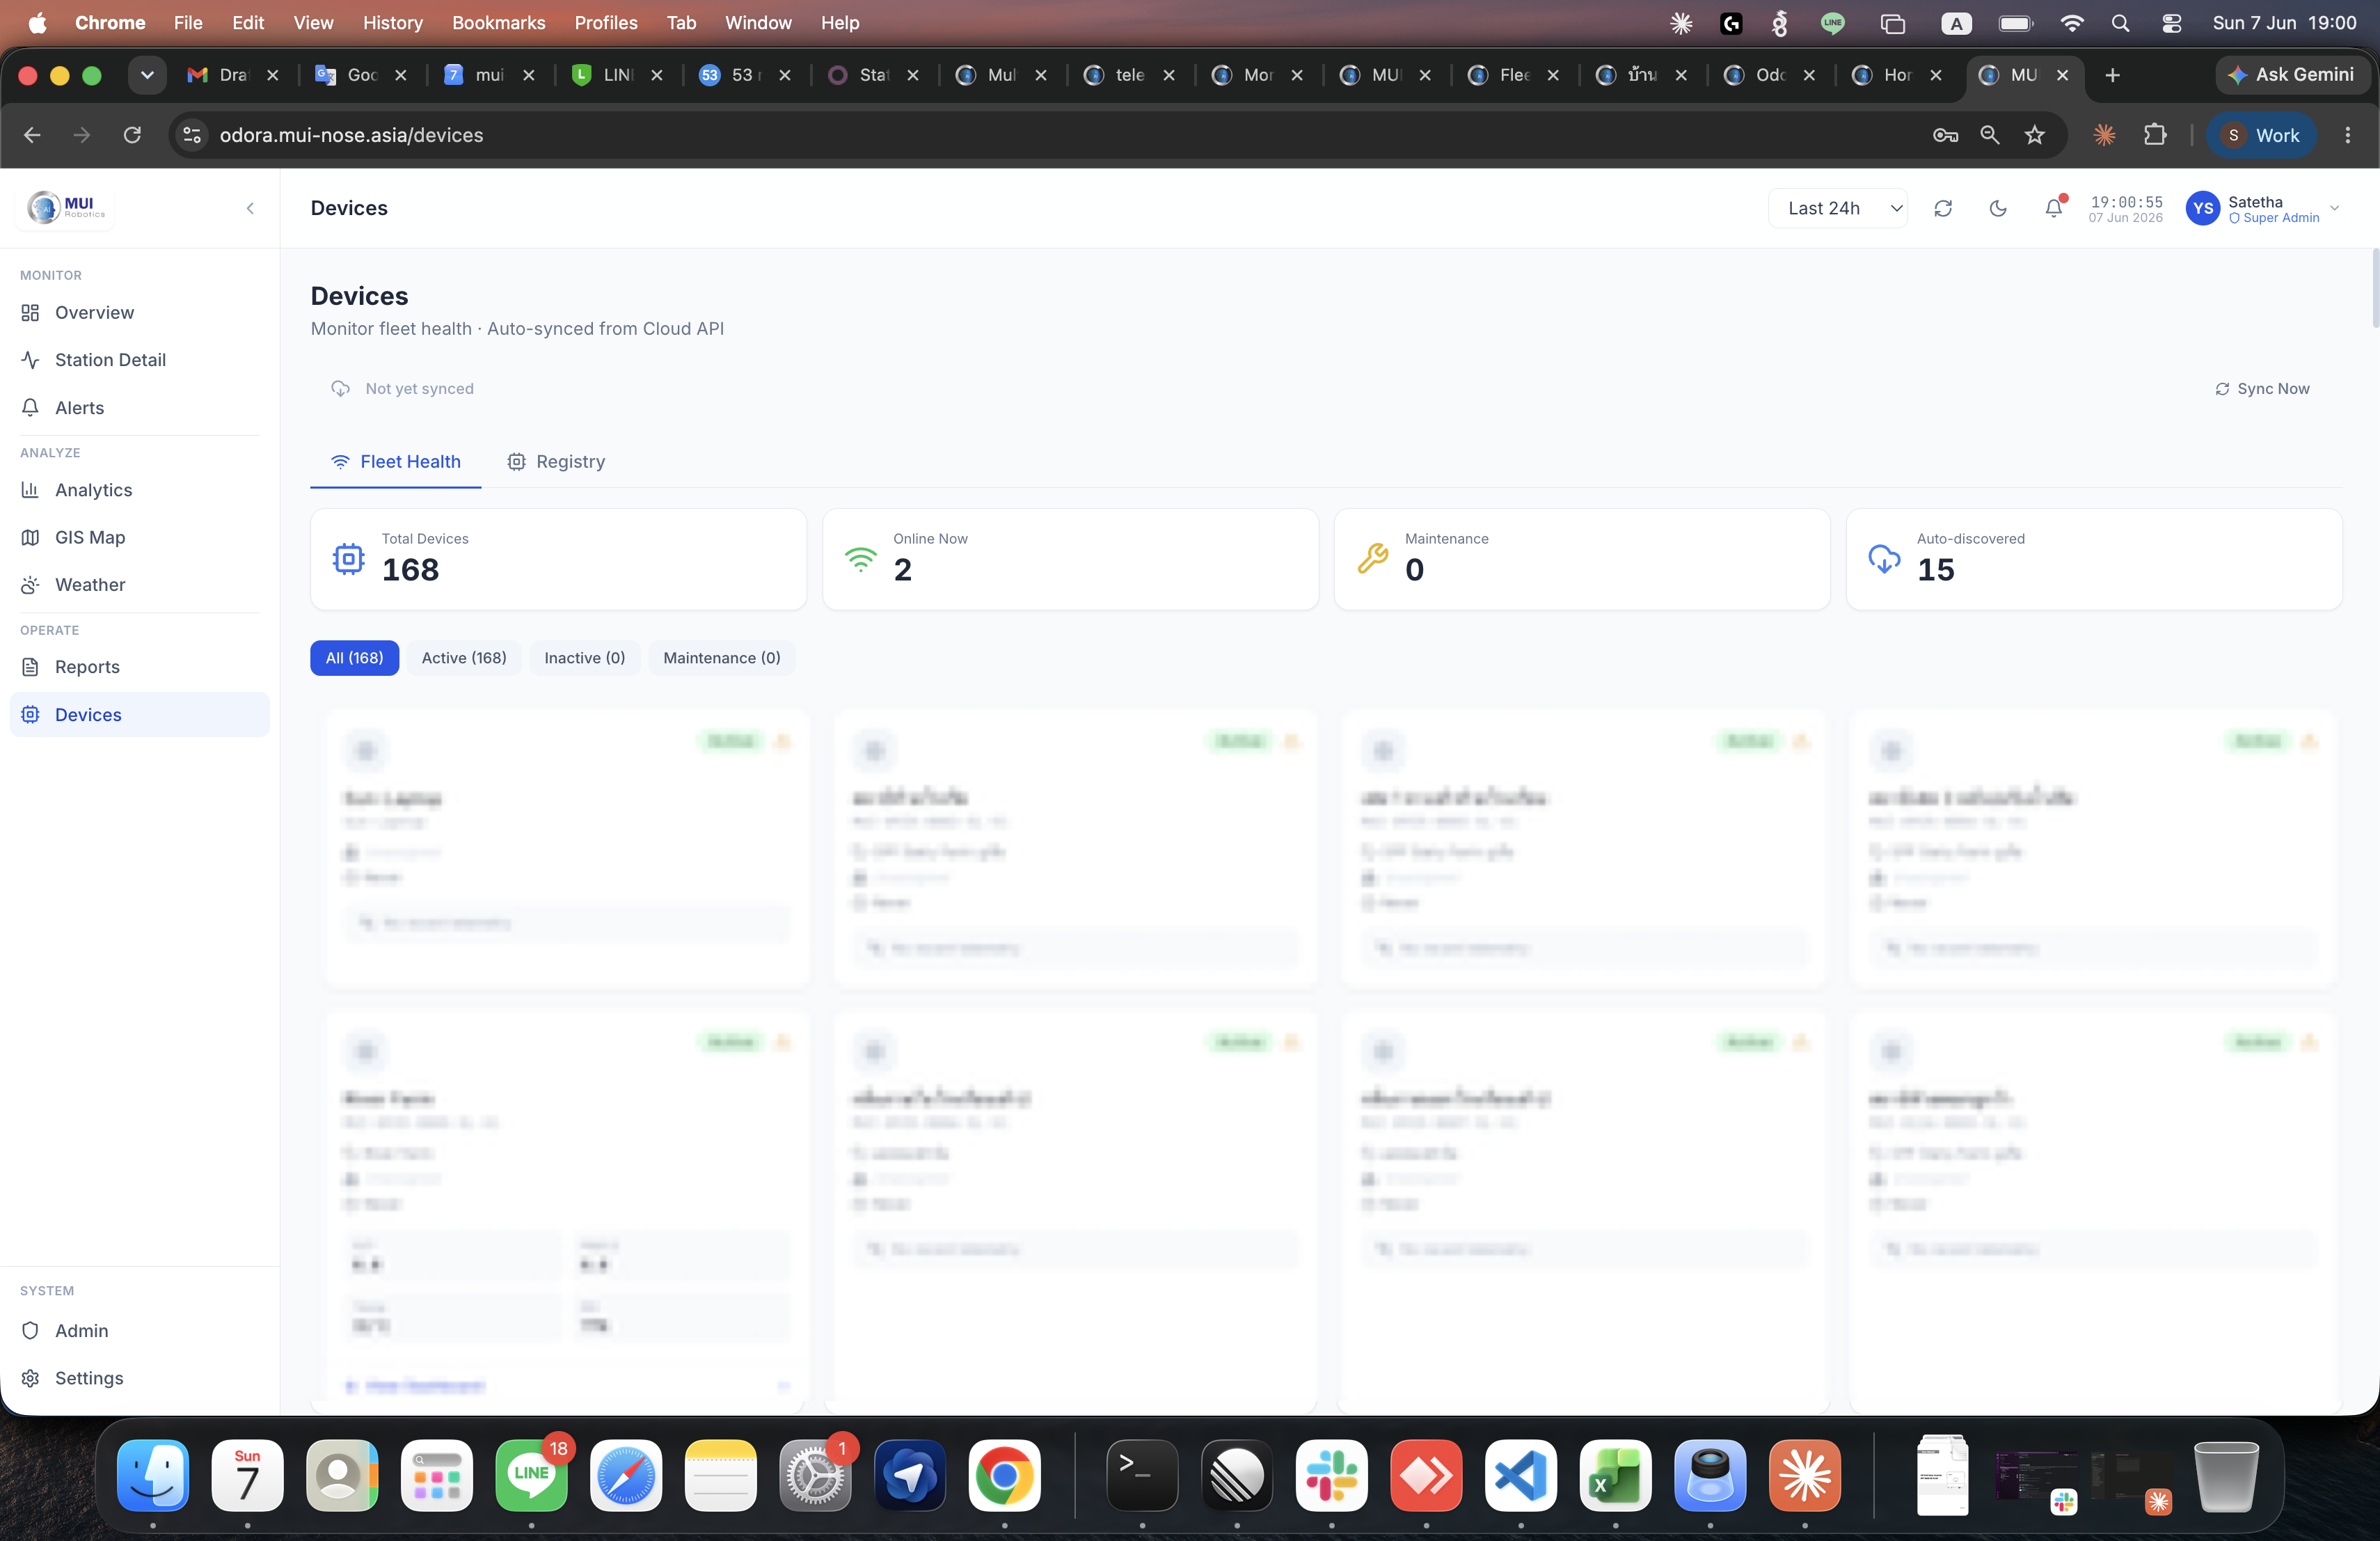
Devices
Live fleet health view plus a device registry where admins can edit organization, model, firmware, GPS, and notes.
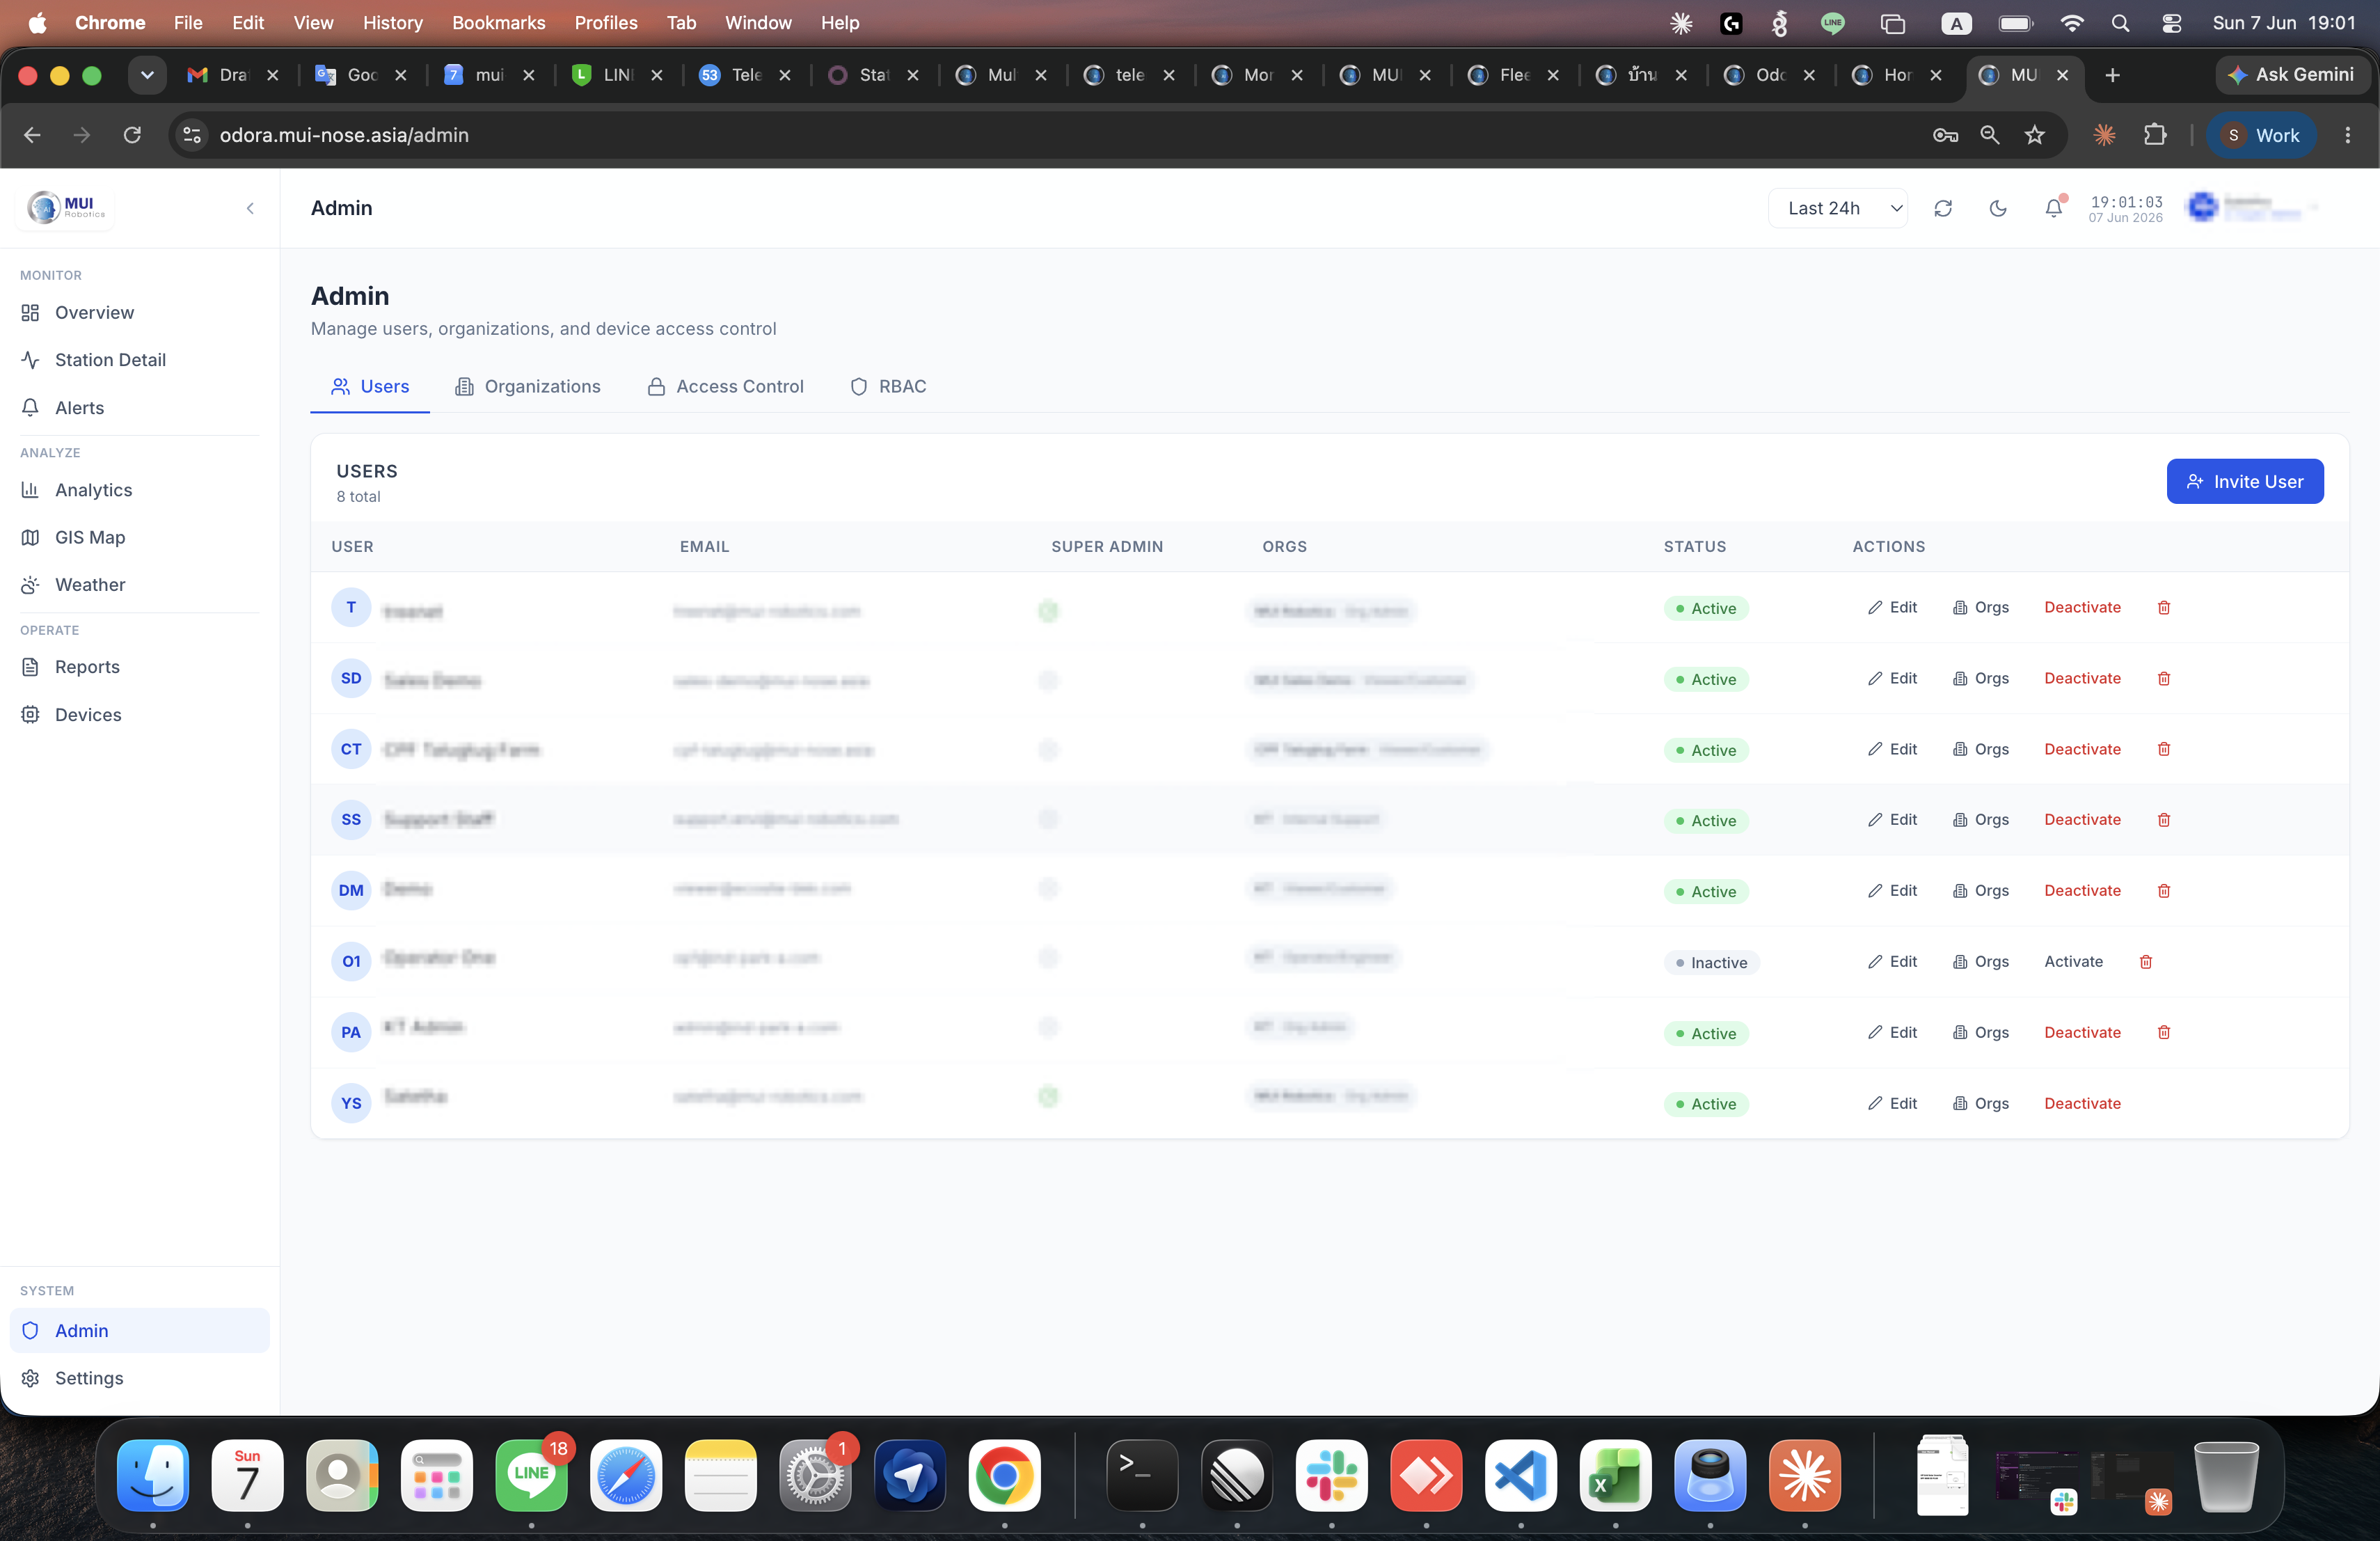
Admin
Role and permission management, organizations, user invitations, and per-organization device access.
[!info] Scope check
Every view described above was verified in the livesrc/pages/tree. ODDS (real-time Gaussian-plume dispersion) and ODDS history are present in the codebase as preview features but are not currently routed in the production build.
Multi-tenant security model
Odora is multi-tenant by design. The model is intentionally simple from the customer's side and strict from the security side.
- One organization per customer. Each customer is a Supabase-backed organization. Users belong to that organization and only see its devices, alerts, reports and settings.
- Role-based access control. Five roles map to integer permission levels —
viewer(20),support(40),operator(50),org_admin(80),super_admin(100). Roles are checked at the route level (page guards inApp.jsx) and at the action level (permission keys via theusePermissionshook). - Per-permission overrides. 39 named permissions can be toggled per role at the org-admin level for finer-grained control.
super_adminalways retains every permission. - Fail-closed by default. If a user's organization membership cannot be confirmed, the device list returns empty and protected pages render an empty state — no partial data is leaked while session state resolves.
- Server-side credential isolation. The browser bundle never sees database credentials. The web tier injects them server-side on the proxied data path. Authentication tokens use the standard
Authorization: Bearerheader pattern.
| Role | Typical user | Sees / can do |
|---|---|---|
| Viewer | Plant staff, executive read-only | Overview, station detail, reports |
| Support | Internal support staff | + Devices page, event log |
| Operator | Plant operator / process engineer | + Alarm rules, complaint management |
| Org admin | Customer's own administrator | + Admin panel, notification recipients, device access |
| Super admin | MUI Robotics staff only | Cross-organization access for support and onboarding |
Real-time data freshness
The dashboard is built around the upstream pipeline described in docs/mui-platform-overview.md — stations sample at 1 Hz on the edge, push a calibrated 60-second aggregate to the cloud, and the dashboard pulls from the cloud time-series store.
| Surface | Refresh behaviour |
|---|---|
| Overview fleet table | Polled — readings reflect within roughly one to two minutes of capture on the edge |
| Station live KPIs | Polled at the same cadence; chart panels re-fetch on time-range change |
| GIS Map | Manual refresh button + automatic refresh on field-selector change |
| ODDS dispersion (preview) | Configurable polling interval; default 90 seconds |
| Historical charts | 1-minute, 1-hour and 1-day aggregates served from the cloud retention tiers — see the platform overview for the retention policy |
The platform does not stream over WebSocket today; polling is intentional for cost, predictability, and offline-graceful UX. Real-time push is on the roadmap.
Reporting and export
Every page that displays data is paired with a way to take that data out of the portal.
| Surface | Output |
|---|---|
| Reports → Data Export | Per-station export table with CSV download (built on a PapaParse pipeline). Time range and field selection are user-configurable. |
| Reports → Scheduled Reports | Recurring PDF report jobs (weekly / monthly cadences). Each schedule names the recipient, sensor field, analysis period and frequency, with a "Send Now" button for ad-hoc generation. |
| Reports → Report Panel | On-demand PDF generation for last 7 / 14 / 30 days, including KPI summary and AQI breakdown — rendered client-side via @react-pdf/renderer and downloaded directly. |
| Notifications | Manual SMS / email send-out from the Alerts and Settings pages, dispatched through a server-side notification function. A persistent log records every send with status (sent / partial / failed) and recipient list. |
| Analytics → Heat Map / Statistical / Event Frequency | Chart views; underlying data exportable through the Data Export tab. |
[!info] PDF reports include
AQI category breakdown (good / moderate / sensitive / unhealthy / very unhealthy / hazardous), per-field daily statistics, and the standard MUI Robotics report cover and footer.
Mobile and device support
The portal is built as a responsive single-page application. The viewport meta tag is configured for mobile, Tailwind breakpoints are used throughout, and the sidebar collapses on narrow screens.
- Best experience: desktop and tablet (1024 px and wider).
- Phone-friendly for the read paths — Overview, Station detail, Alerts and Reports are usable on a phone for on-call checks.
- Map and Analytics work best on tablet-or-larger because of their density.
- No native mobile app. A modern phone browser is all the customer needs.
Integration with the broader MUI Platform
Odora is the dashboard surface of the MUI Platform. Stations in the field measure odor, air quality and weather, push calibrated 60-second aggregates to the MUI Robotics cloud, and the customer accesses everything from any modern browser via Odora. The customer never has to operate any infrastructure — no on-premise server, no agent install, no firewall change. The upstream sensing, calibration, alerting and retention story is the same across every customer and is documented in docs/mui-platform-overview.md; this document covers only what the customer touches.
What's new and on the roadmap
Recently shipped:
- GIS Map workspace — full-screen interactive Leaflet map with AQI-coloured markers, halo / label / online-only / alert-only layer toggles, station detail slide-in panel, and a fleet-stats summary bar.
- Analytics module — six analysis tabs (Temporal, Statistical, AQI Analysis, Heat Map, Event Frequency, Justification) replacing what used to be a single chart strip.
- Notification system — SMS and email notifications with a persistent log, recipient management, and ad-hoc send from any alert or event.
- Scheduled PDF reports — recurring reports with cadence selection, "Send Now" override, and a clean per-organization report template.
- Per-org AQI standards — customers can pick the AQI standard and averaging period (e.g. US EPA vs. local) used by their dashboard and reports.
- Live device sync — admins can pull the latest device list from the platform on demand; new devices are auto-registered with their last-seen timestamp.
Near-term roadmap (not yet shipped — no dates committed):
- Streaming refresh (server-sent events or WebSocket) to replace polling on the fleet and station views.
- ODDS real-time dispersion as a generally available route, with historical playback.
- Single sign-on (SSO / SAML) for customers with their own identity provider.
- Webhook outbound from the alert pipeline for SCADA / historian integration.
- Mobile-first refresh of the Overview and Station pages for on-call workflows.
Next steps
- Schedule a live walk-through against the customer's own pilot devices once the first stations are commissioned.
- Confirm the customer's initial user list and per-user role assignment (org admin vs. operator vs. viewer).
- Agree the alert thresholds per parameter and the recipient list for SMS, email and messaging-channel alerts.
- If the customer has an identity provider, capture SSO requirements early so they can be folded into the onboarding plan.
- Walk the customer's compliance lead through the Reports page (PDF generation, scheduled reports, CSV export) to confirm the evidence workflow fits their regulator's expectations.